


[BR] DR - Canvas (Dashboard)
Document status | COMPLETED |
|---|---|
Last Updated |
|
Document owner | |
Designer | |
Developers |
|
QA |
|
Related Documents | |
Version | V1: |
Overview
As part of Reporting 2.0, the concept is the ability to create a dynamic report. One part of the dynamic reporting is the ability to create a dashboard and apply widgets. This is the requirements and designs for the canvas (dashboard).
IMPORTANT: Specifications for the widget templates can be found here. The examples contained within this document are for demonstrating how the canvas work, and do not represent actual widget specifications and functions.
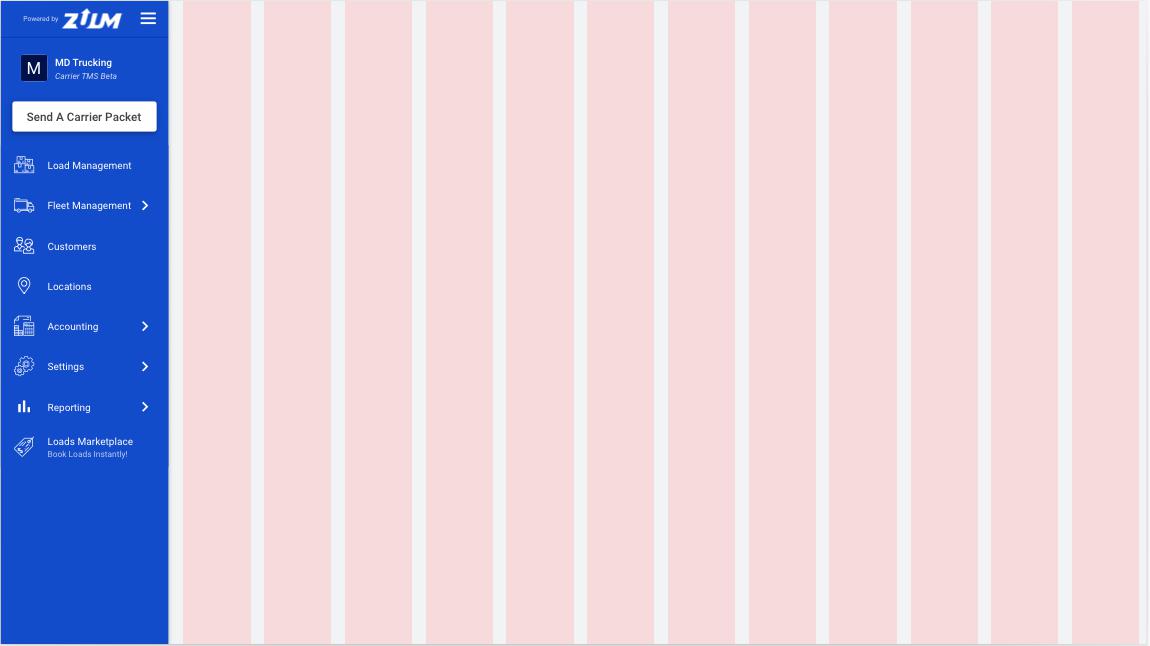
A Dashboard Structure
Layout
The Dashboard uses a 12-column layout with the following settings:
Columns: 12
Max width: 1156px
Offset: 210px from the left
Gutter width: 16px
Gutter on outside
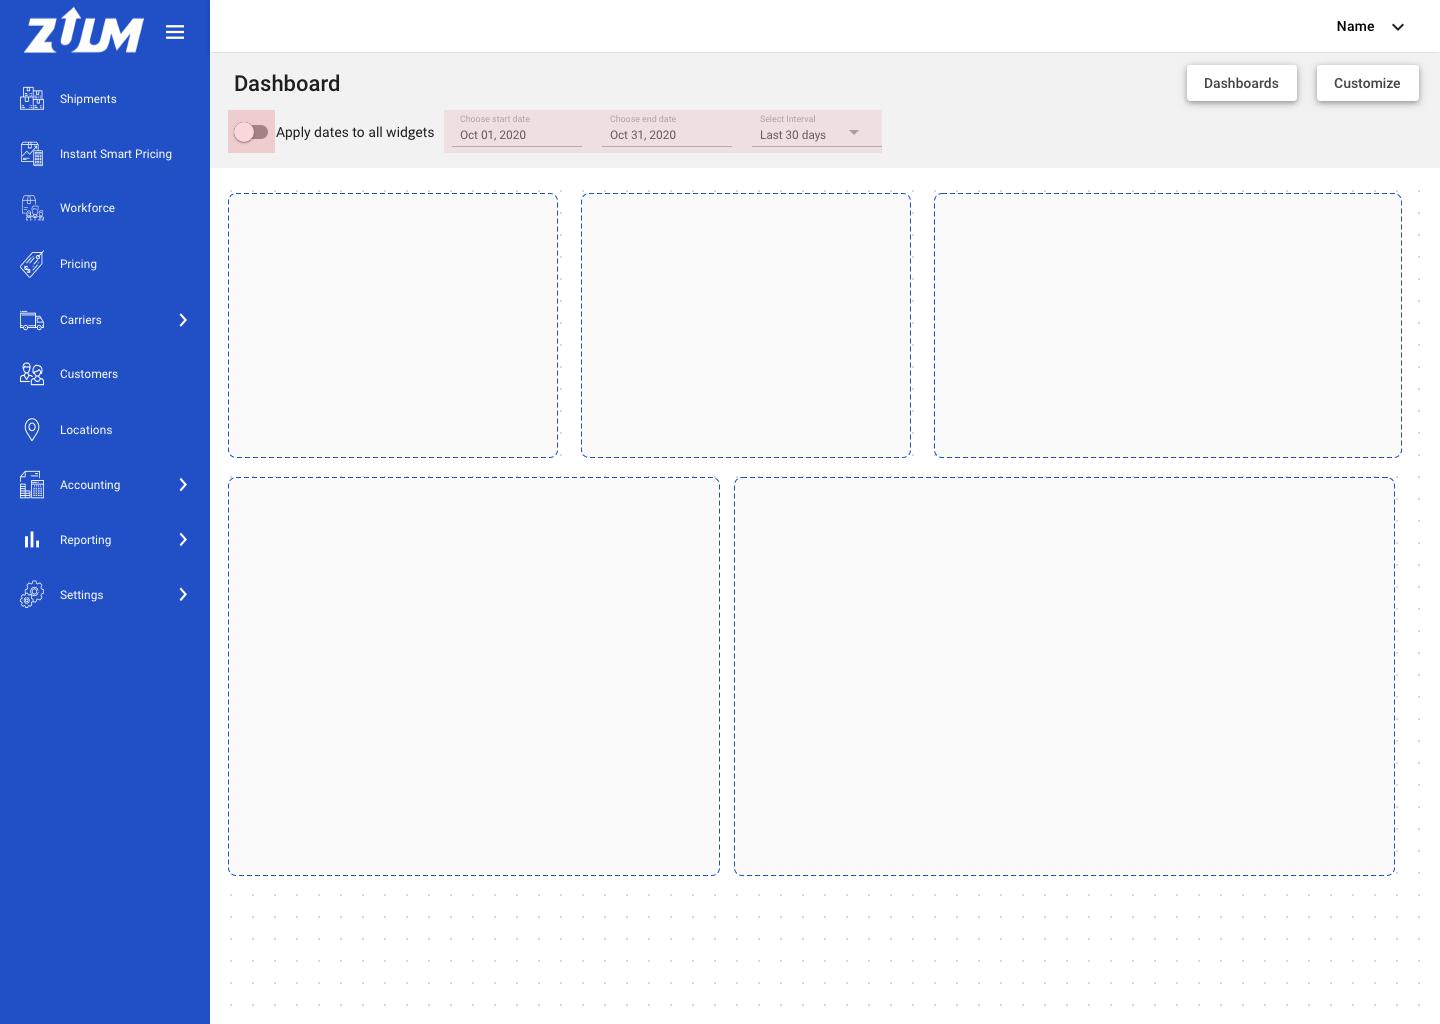
A1 As a user, I can see my dashboard and toggle ON or OFF to apply the date range to all widgets.
Design (2 screens): IMG 1 | IMG 2
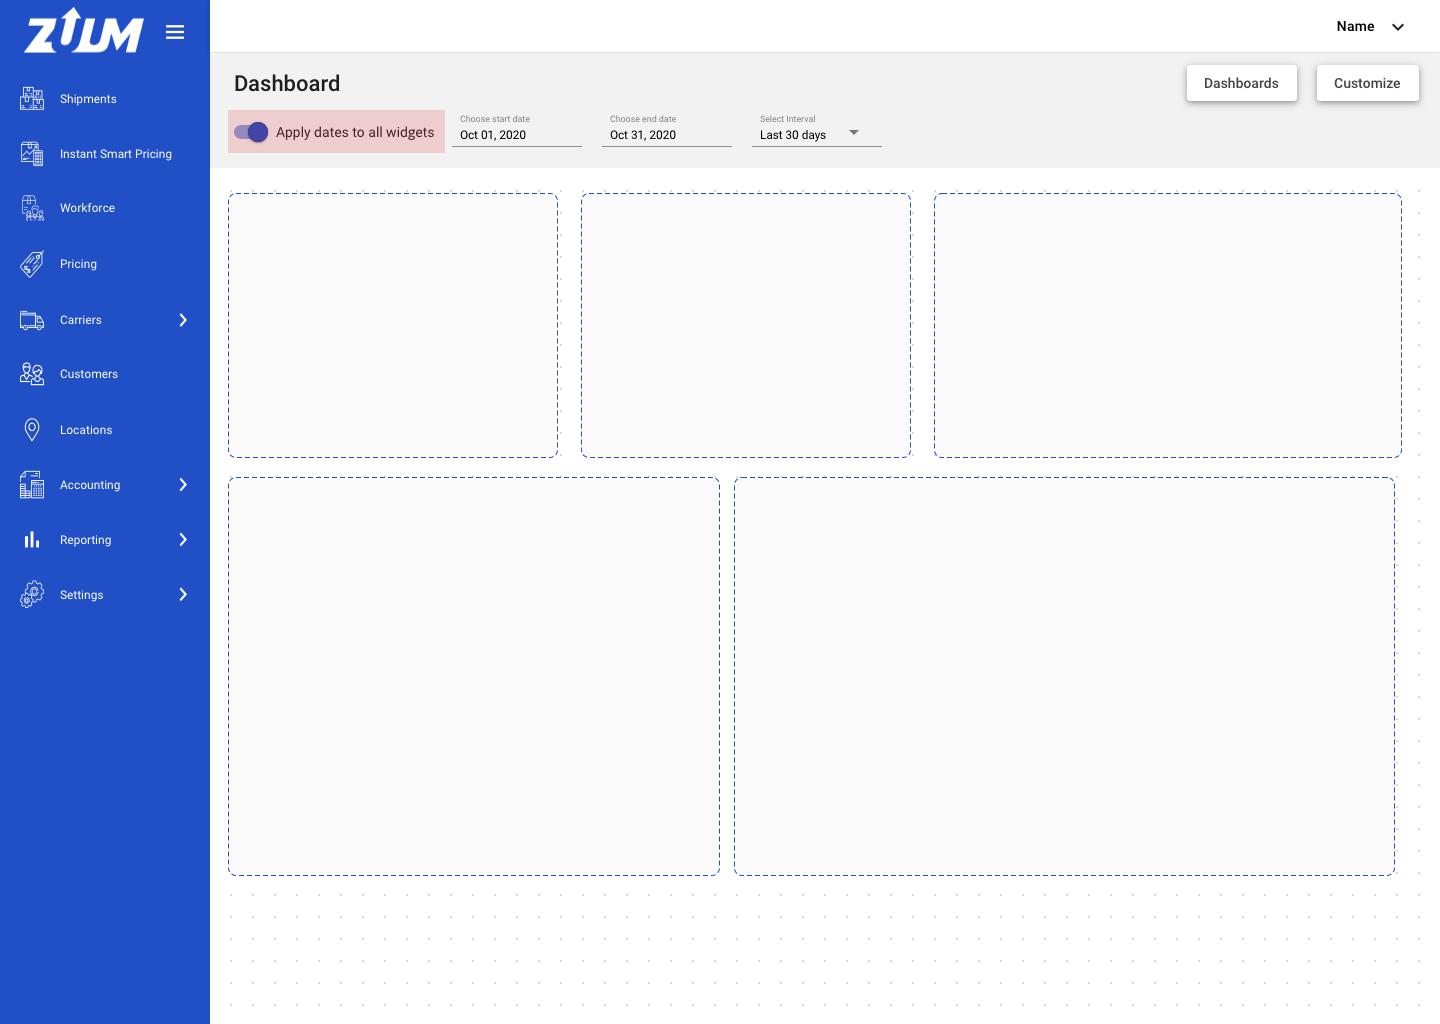
When the user clicks the ‘Dashboard’ page:
First Time: the dashboard will display the pre-set dashboard for that user’s department
Created an additional dashboard: display the first dashboard the user modified or created.
The dashboard page will display:
Toggle and date range
DashboardbuttonCustomizebutton
Toggle ‘Apply dates to all widgets’
each widget will have its own date range selection. This toggle is giving the user the ability to override the date range for ALL widgets
When the toggle is ON, display the widget contents that matches within the date range selected
When the toggle is OFF, display the selected date range in the widget card
disable the ‘Start Date’, ‘End Date', and ‘Interval’ textfields
A2 As a user, I can select the ‘Customize’ button to perform an action to my dashboard.
Design: IMG 1
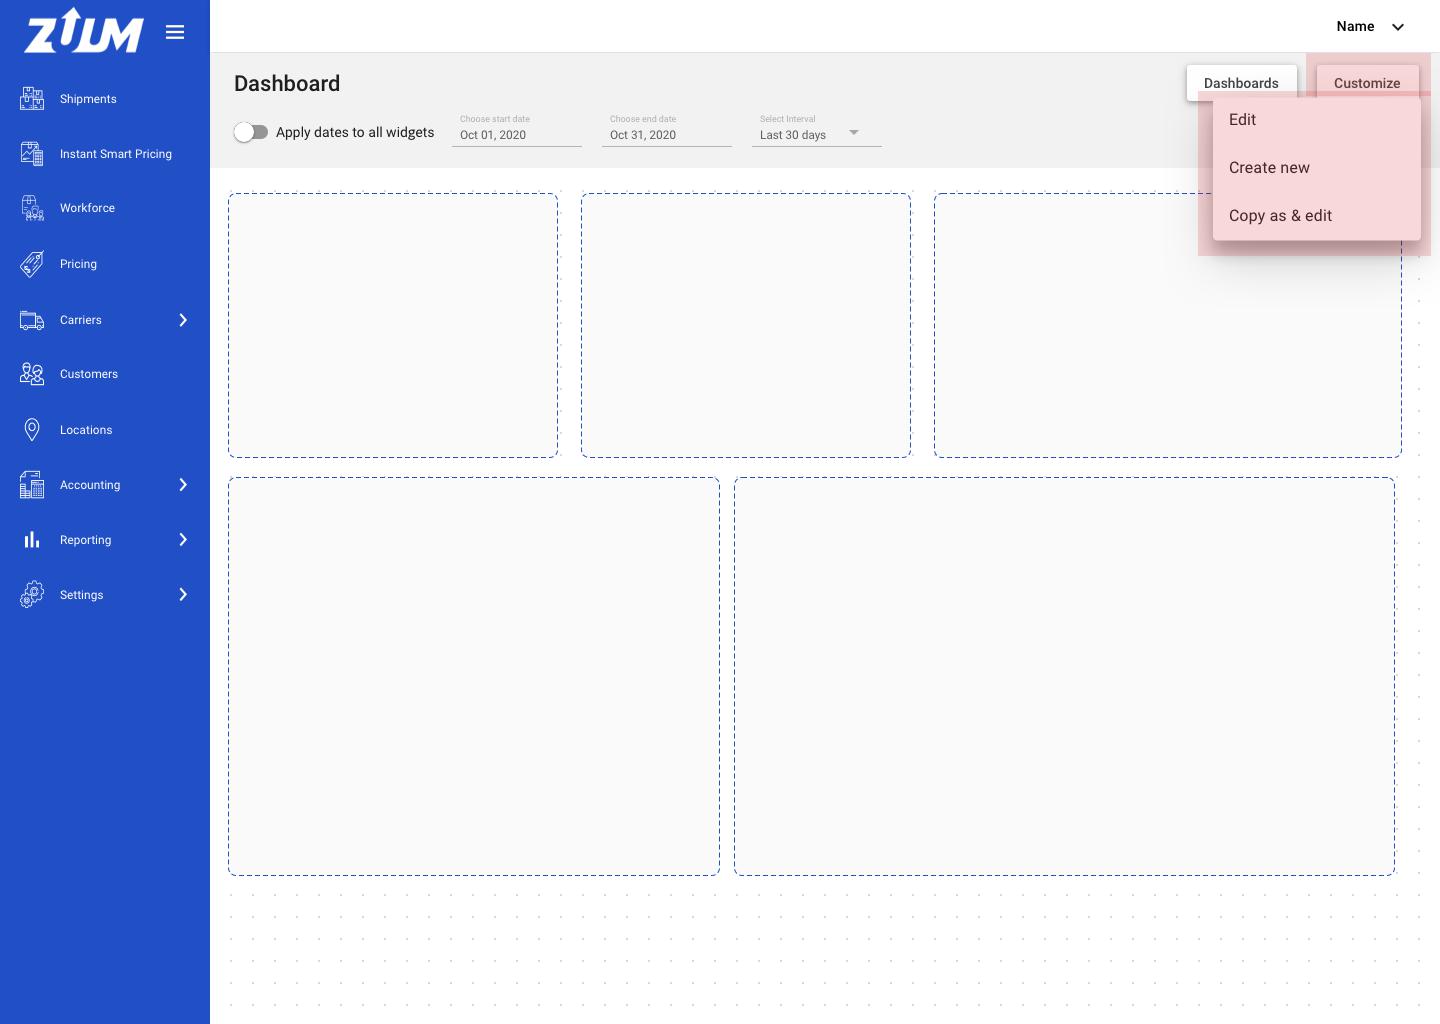
When the user clicks `Customize' a dropdown menu will appear with:
Edit
Create new
Copy as & edit
Edit
Edit the current dashboard. This will go into edit mode
Create new
create a new dashboard
Copy as & editcreate a separate copy of the current dashboard and enter edit mode
B Create and Edit Dashboard
B1 As a user, I can create a new dashboard and choose to create from blank or a pre-set dashboard.
Design (2 screens): IMG 1 | IMG 2 - Create from pre-set
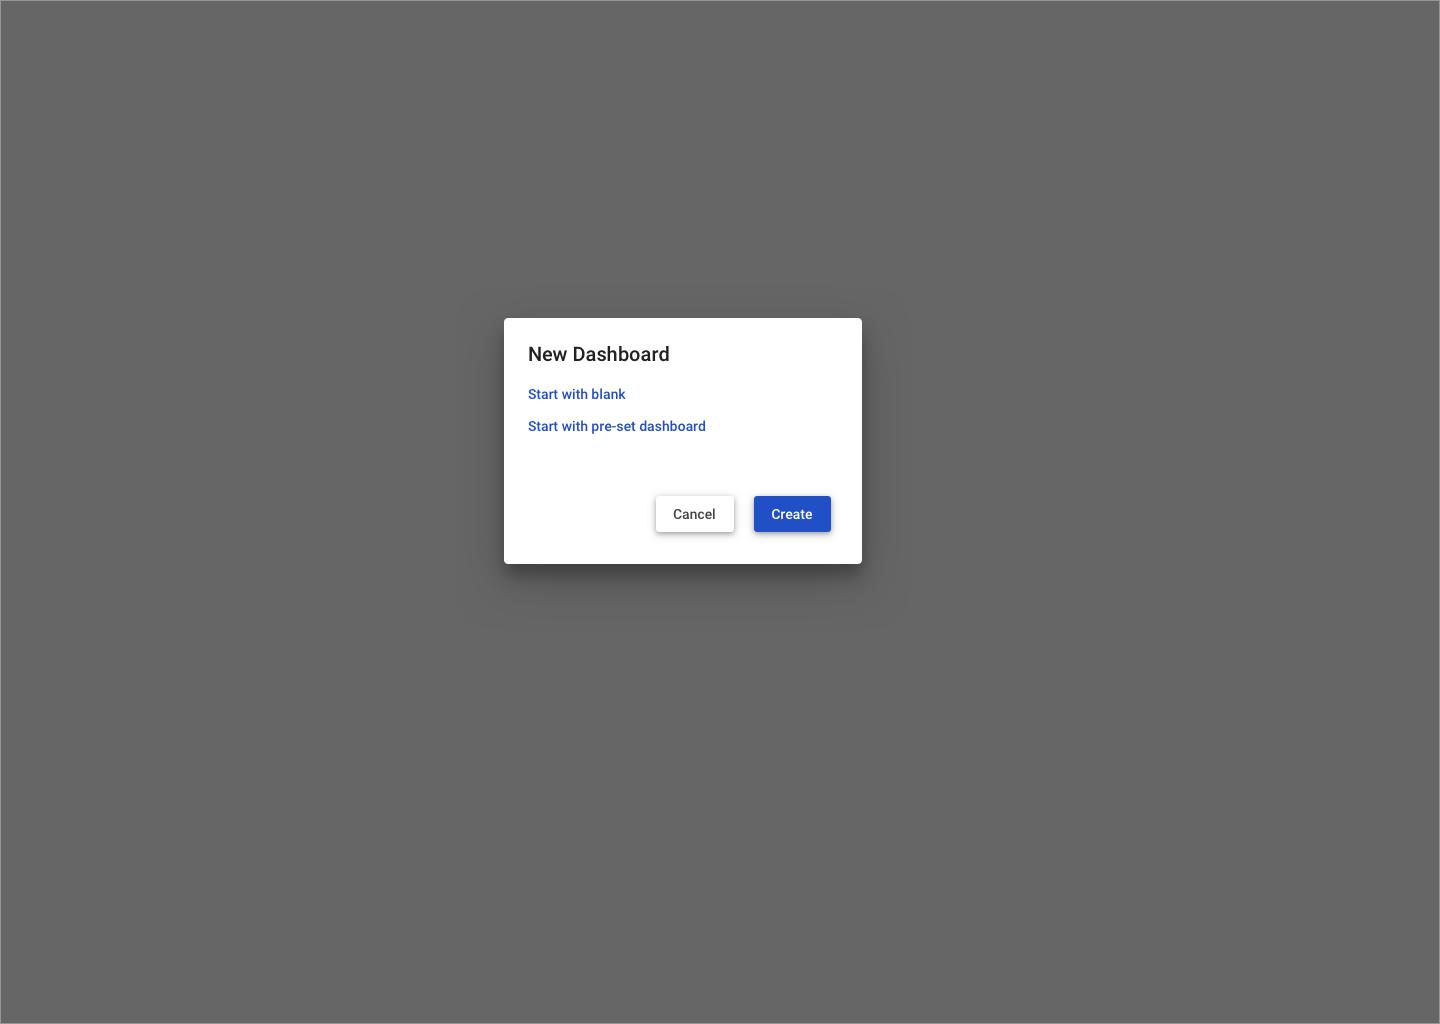
When user clicks
Create newfrom theCustomizebutton options a modal will appear with the options:Start with blank
Start with pre-set dashboard
When the user selects
Start with blankan empty state dashboard in edit mode will appearWhen the user selects
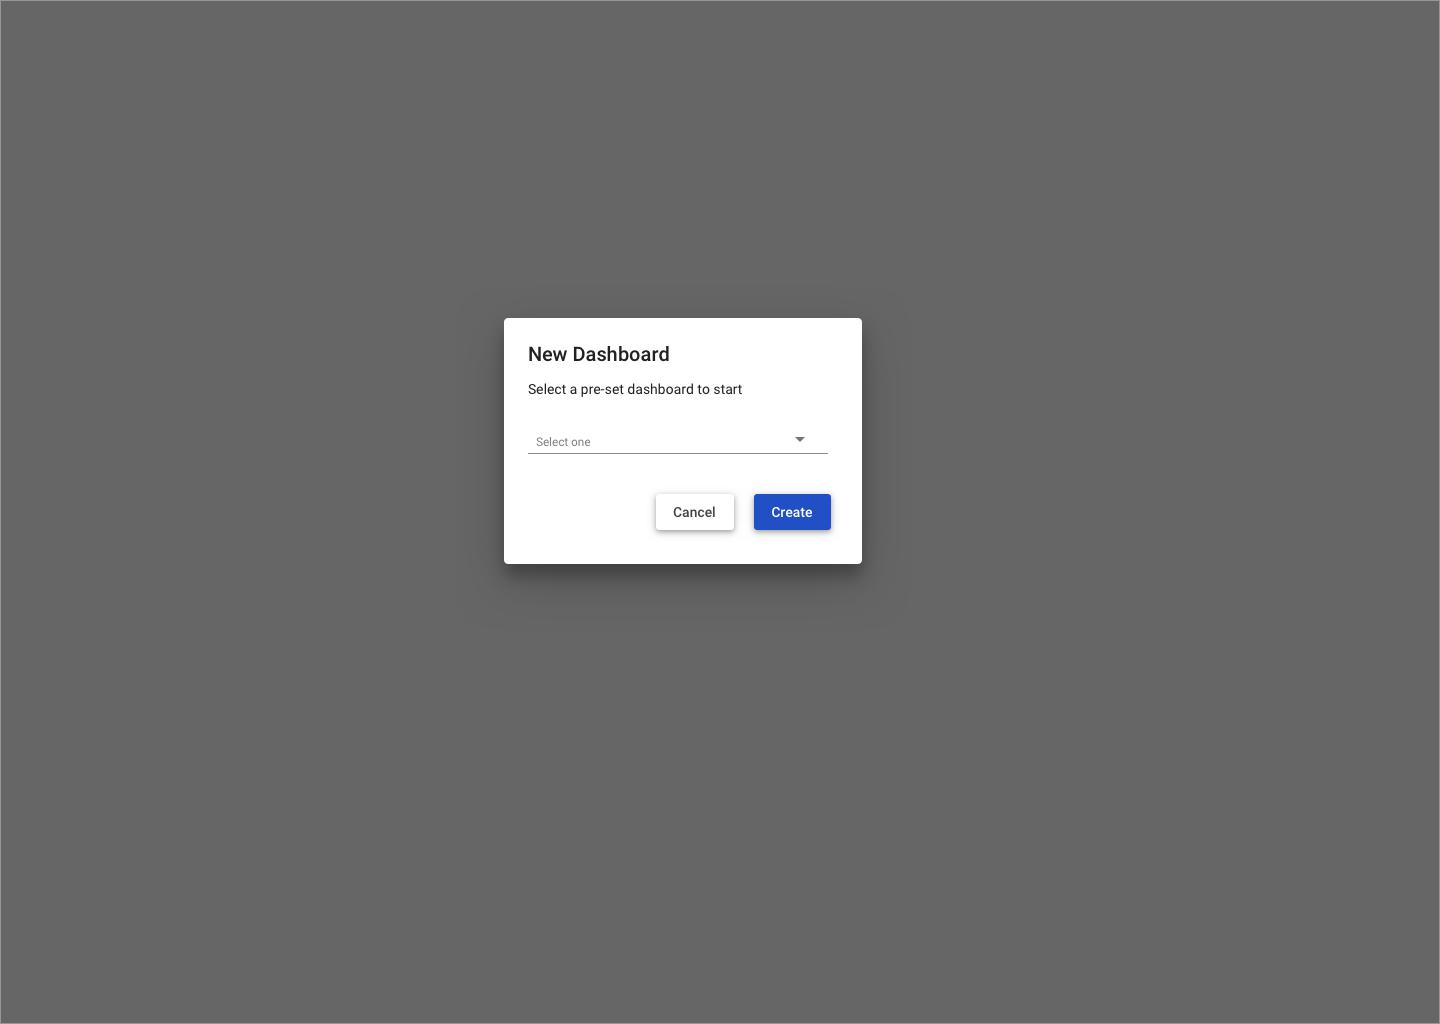
Start with pre-set dashboardthe modal contents will change and display:Explanation text
Dropdown text field that lists all the available pre-set dashboards
*only the available pre-set dashboards will display depending on the user’s department and role
B2 As a user, I can edit and create my dashboard when in edit mode.
Design: IMG 1
After the user selects
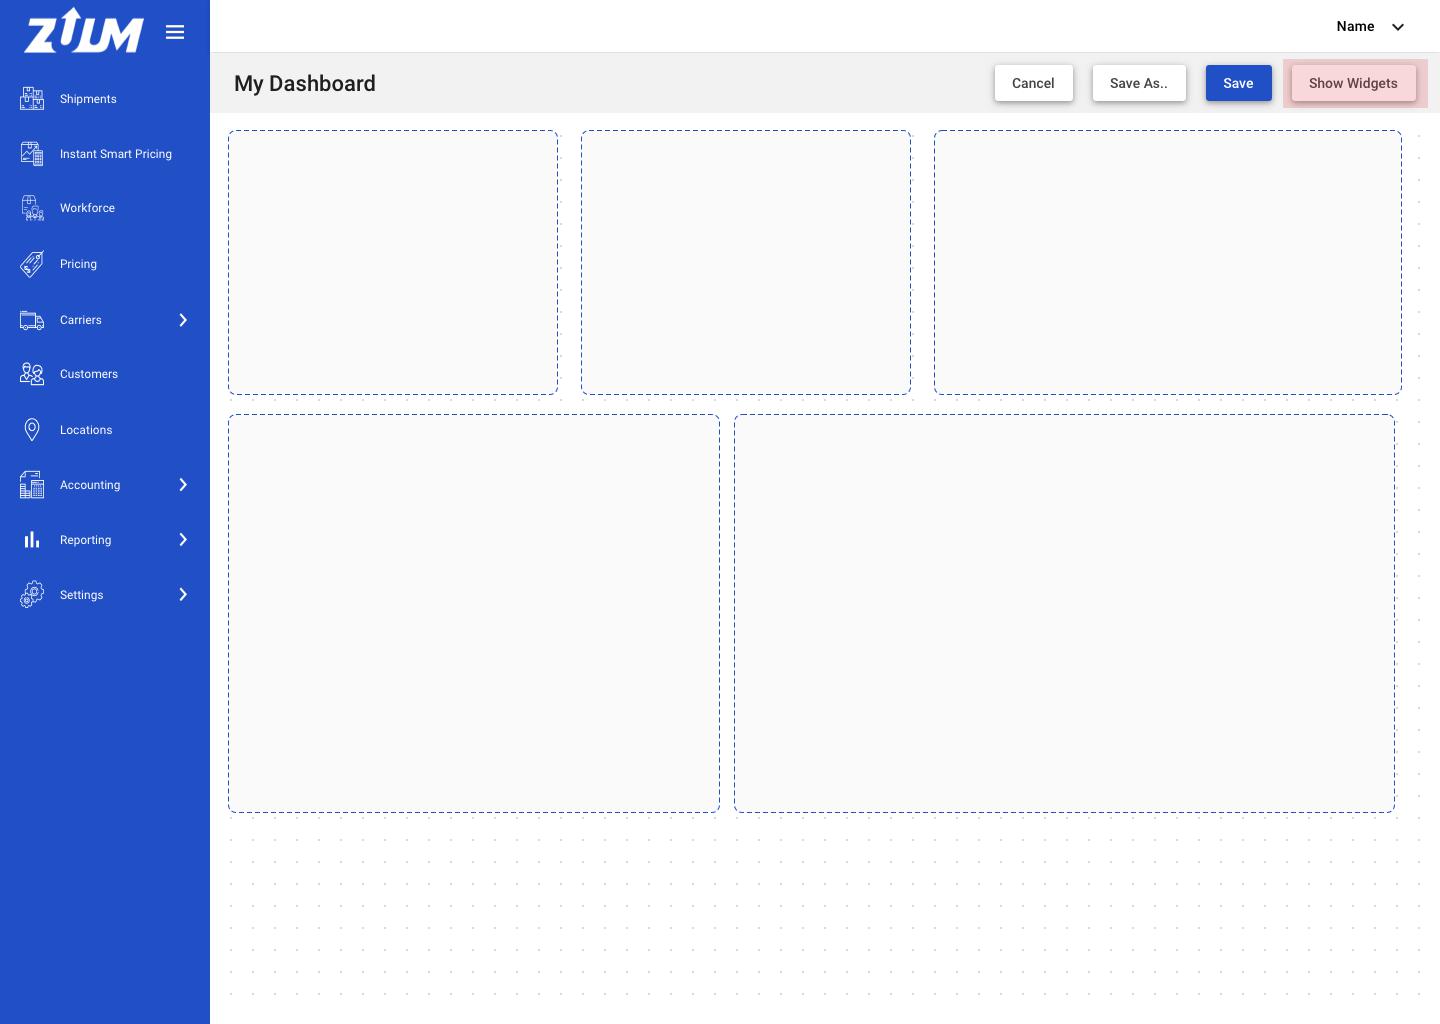
Start with blankorStart with pre-set dashboardthe user will enter edit mode, where the user can: add, move, and delete widgets.If
Start with blankthe dashboard space will be empty. The user can see a grid as a guide of how to arrange their dashboardIf
Start with pre-set dashboarddisplay the pre-set dashboard widgets
The header of edit mode will display:
Cancel
Save As..
Save
Show Widgets
Cancel - this will cancel the dashboard completely. A modal should appear letting the user know that their changes will not be saved.
Save As.. - creates a copy of the current dashboard and saves
Save - saves the current dashboard
Show Widgets - this shows or hide the widget sidebar
B3 As a user, I can show and hide the widget sidebar.
Design (2 screens): IMG 1 - Hide | IMG 2 - Show
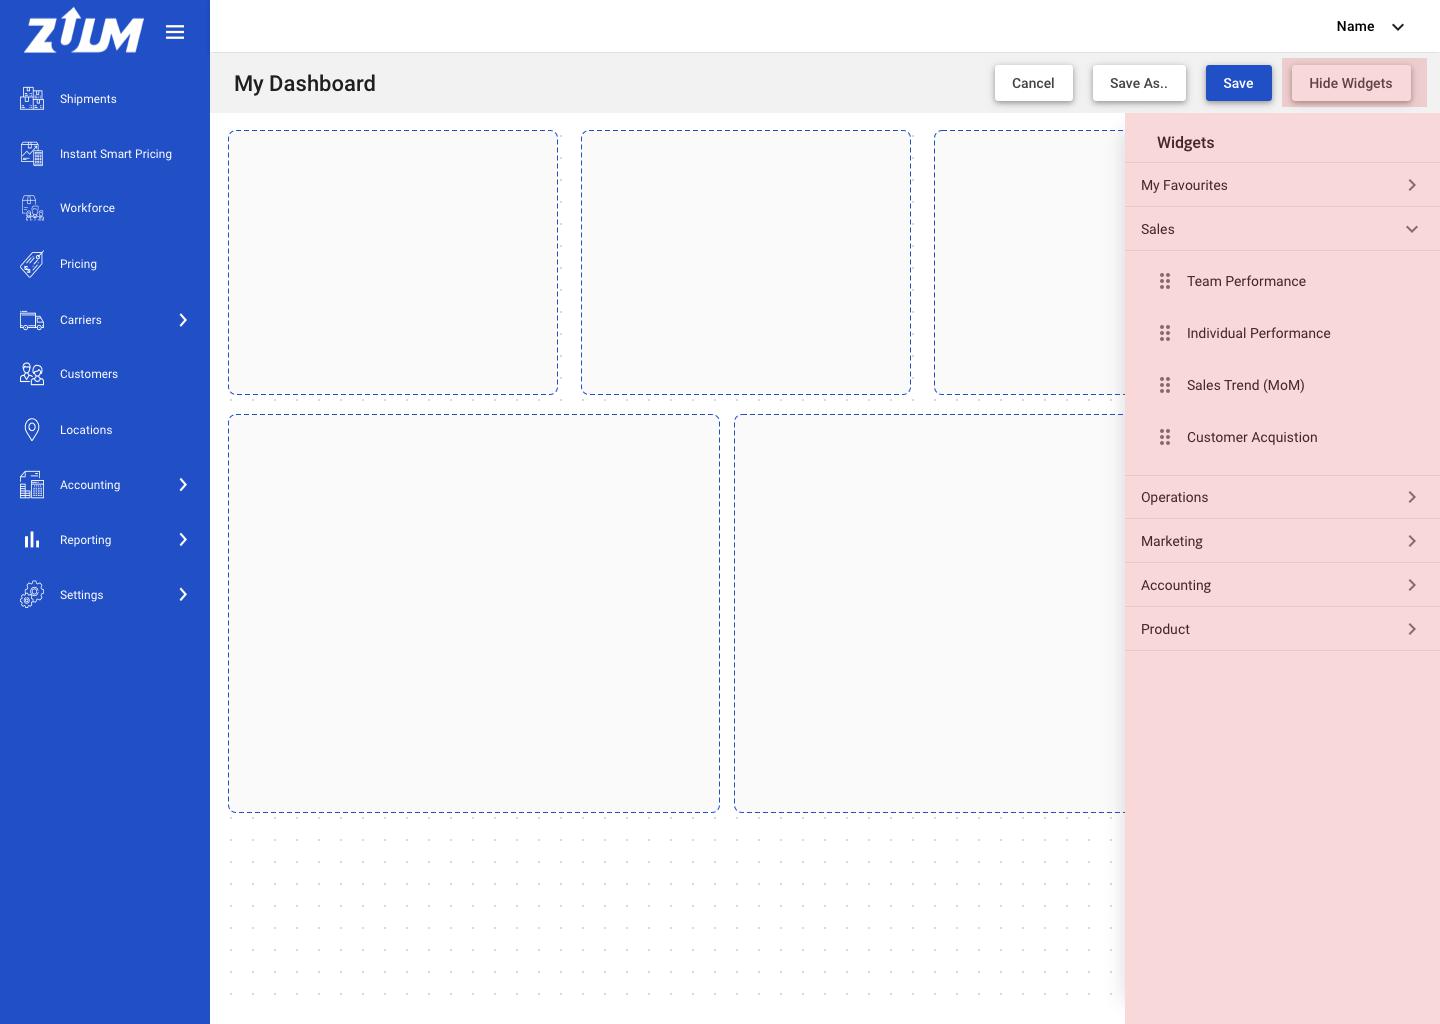
The user can show and hide the widget sidebar.
If the sidebar is hidden the button should display:
Show WidgetsIf the sidebar is displayed the button should display:
Hide Widgets
Use a transition animation where the sidebar appears ‘Right to Left’ and disappears ‘Left to Right’
When viewing the sidebar, there will be sections with each department, it should display:
My Favourites
Sales
Operations
Marketing
Accounting
Product
When the user expands on a section, the widgets that belongs to the section will appear. Refer to the spreadsheet to see list of available widgets
*only the available widgets will display depending on the user’s department and role
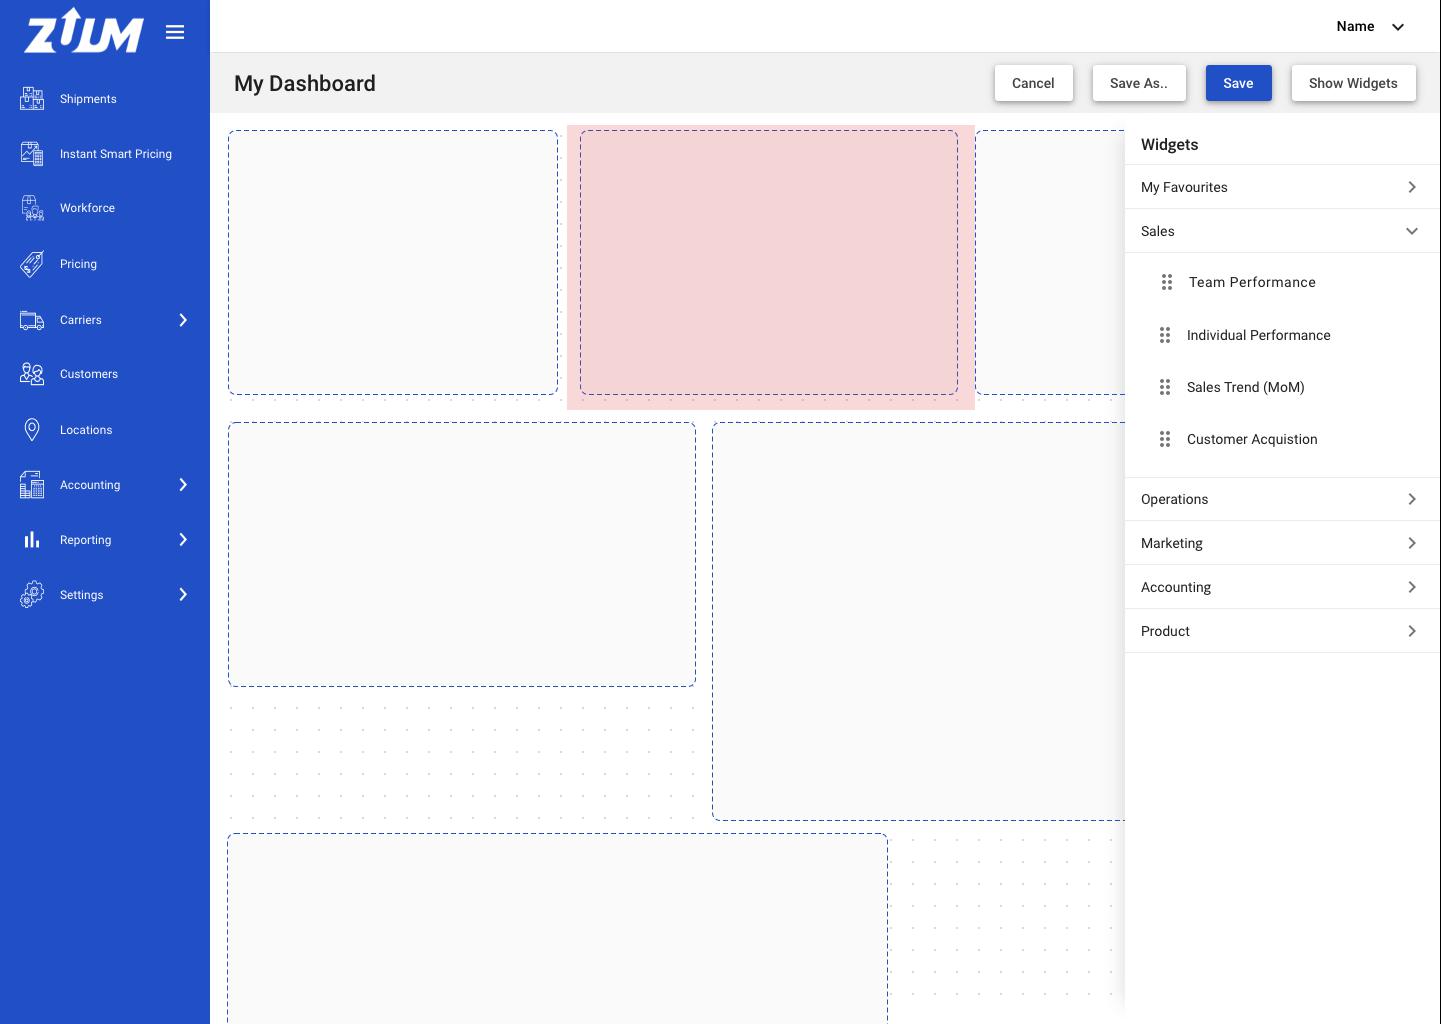
B4 As a user, I can drag a widget to the dashboard and place it anywhere I can.
Design (2 screens): IMG 1 - Drag | IMG 2 - Drop
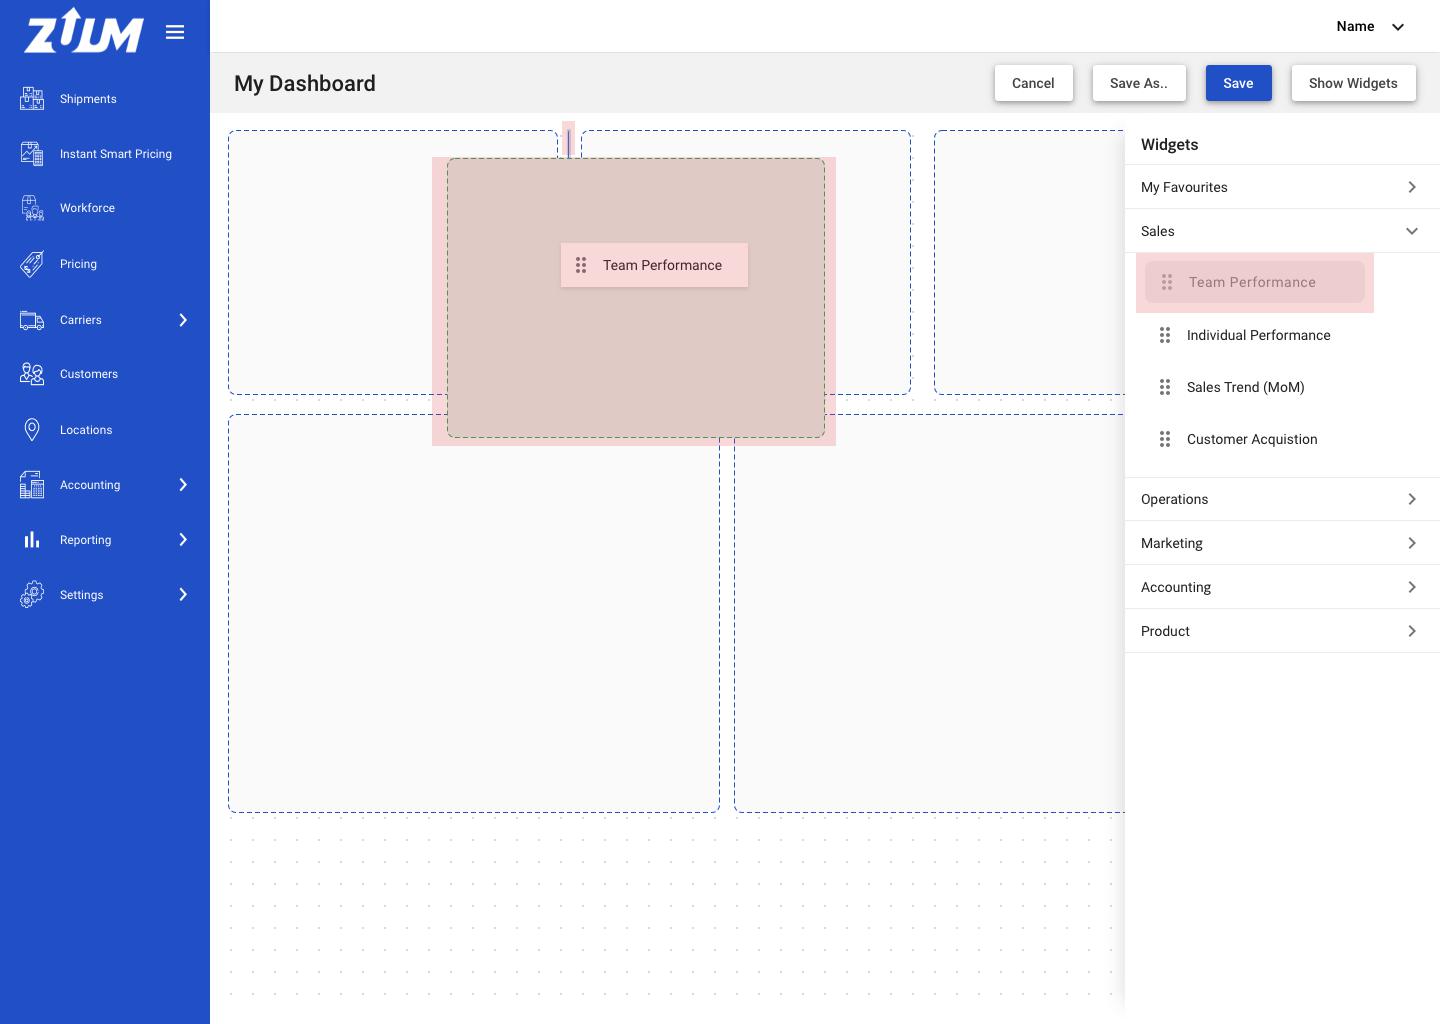
The user can click and drag a widget to the dashboard
When this happens, the selected widget on the sidebar will be disabled (lower opacity)
the user can see the widget on their mouse curser, as they are dragging the widget across the screen
If the user chooses to put a widget in between other widgets, display a blue line, indicating to the user this is where the widget will be placed
if this happens, shuffle all the other widgets over to the right, and move widgets down the screen if needed.
B5 As a user, I can save my dashboard and give it a name (first time creating).
Design: IMG 1
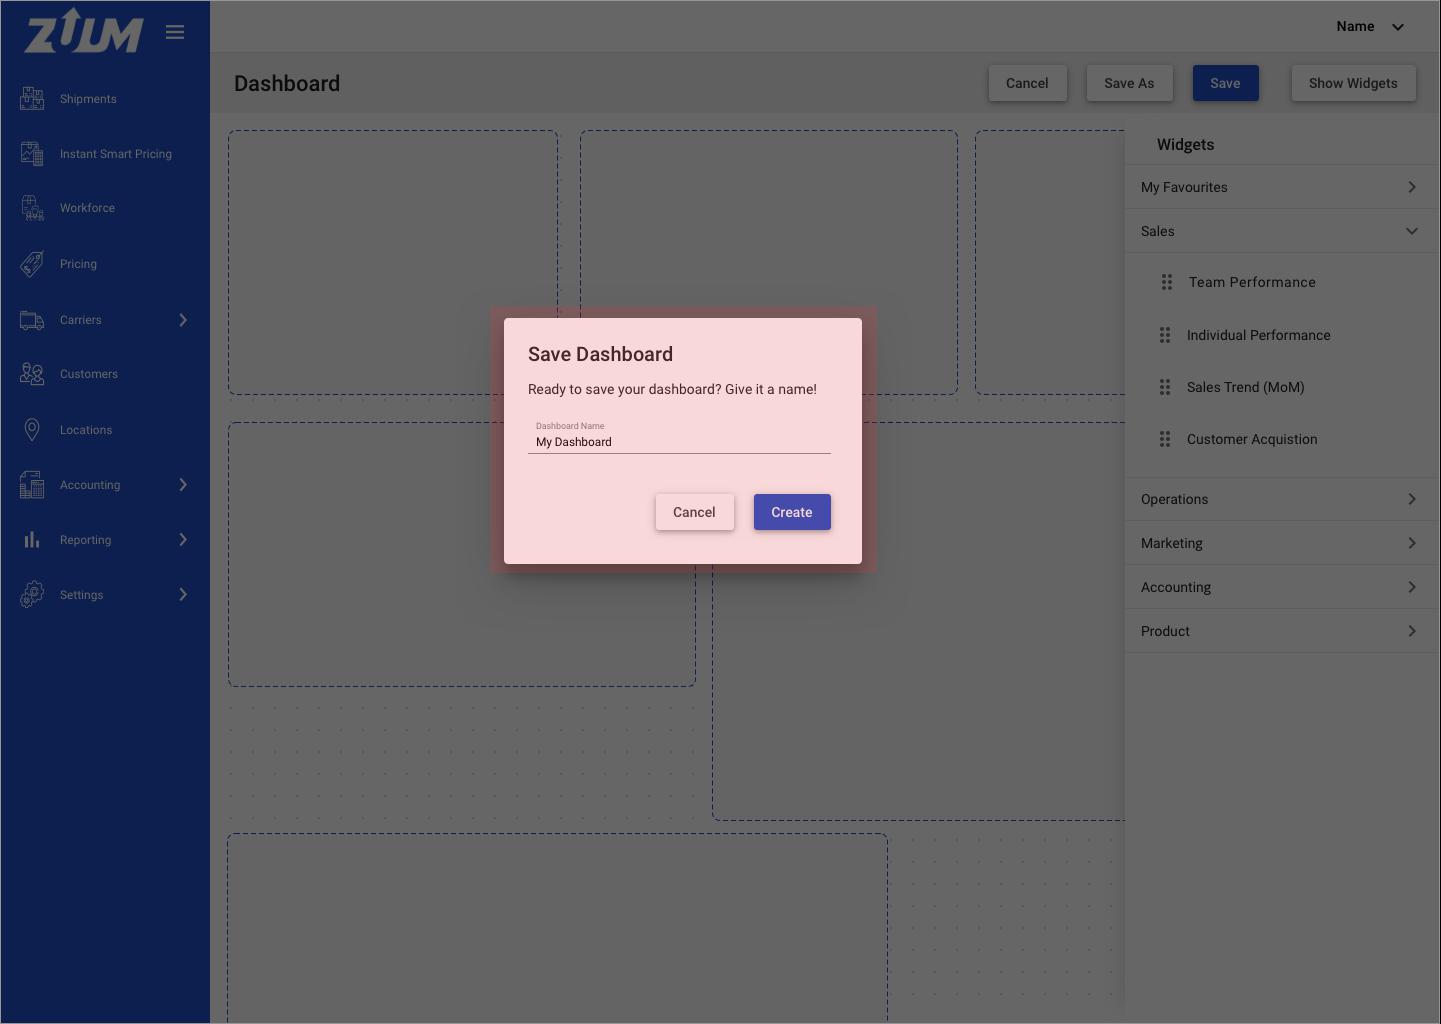
When the user clicks
SaveorSave As..the dashboard will save and will no longer be in edit mode. This will save and update the dashboard.If first time creating a dashboard, a modal will appear asking the user to name their dashboard. This also applies when
Save As..has been clicked.If not first time, a modal will appear asking if the user is ready to save.
C View and toggle between Dashboards
C1 As a user, I can click the Dashboard button and a sidebar will appear with available dashboards.
Design: IMG 1
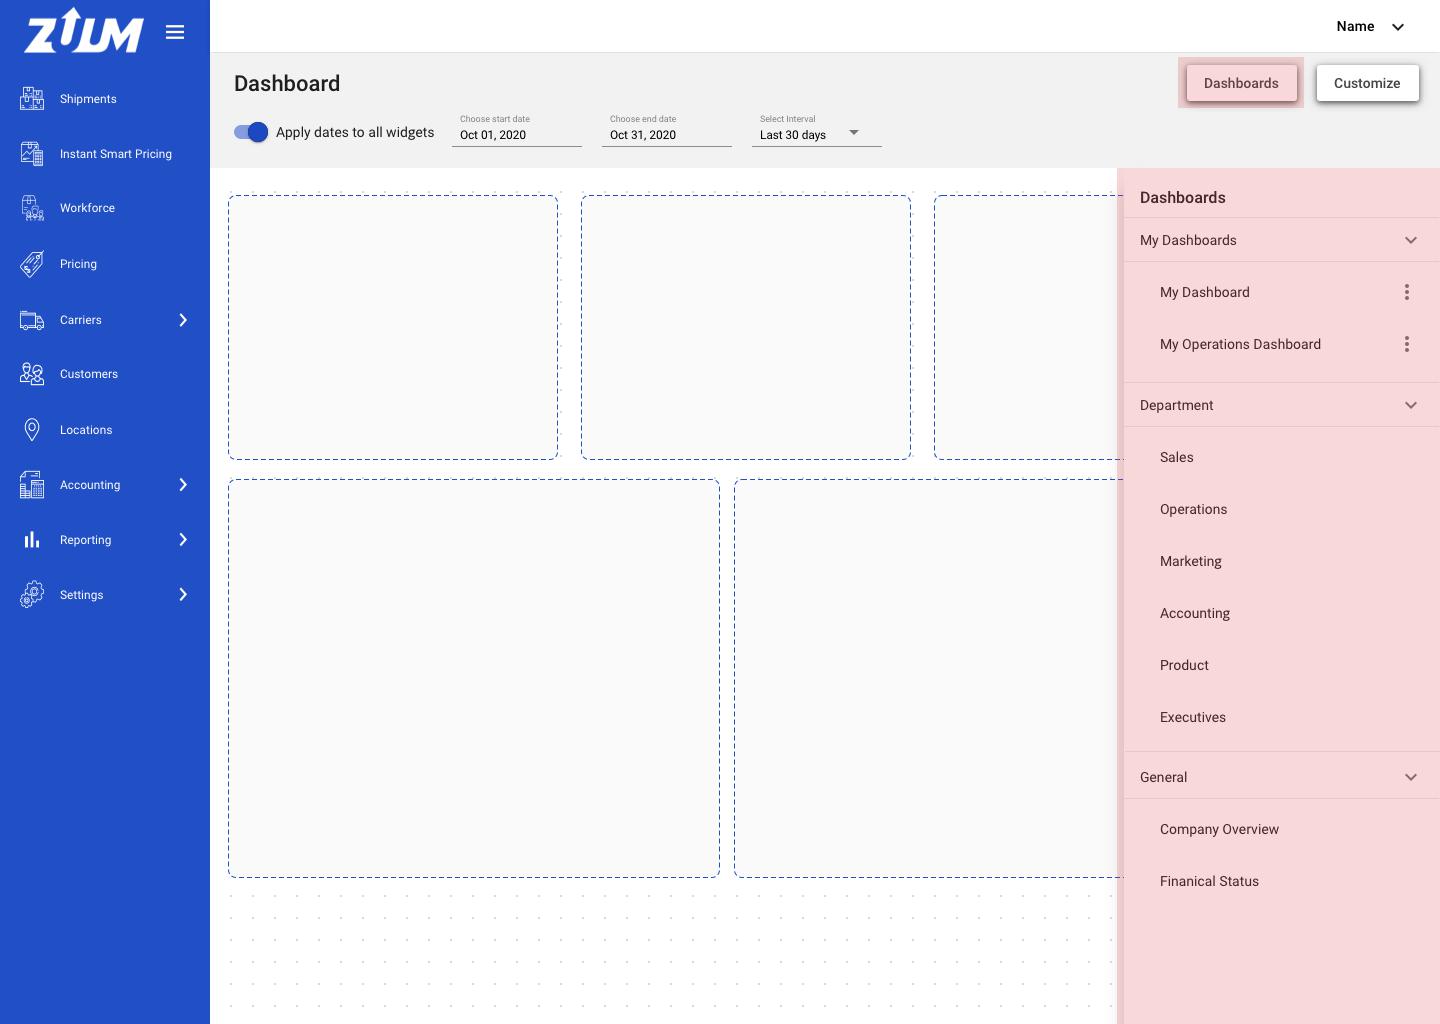
When user clicks
Dashboard(non-edit mode) the Dashboard sidebar will appear. This is where the user can toggle between their created dashboards and view the pre-set dashboards.*only available dashboards will be displayed, depending on the user’s role and permissions
When the user clicks
Dashboardagain, the sidebar will disappear.The sections that will be displayed are:
My Dashboards
the dashboards that the user created
Department
General
C2 As a user, I can manage dashboards I created.
Design: IMG 1
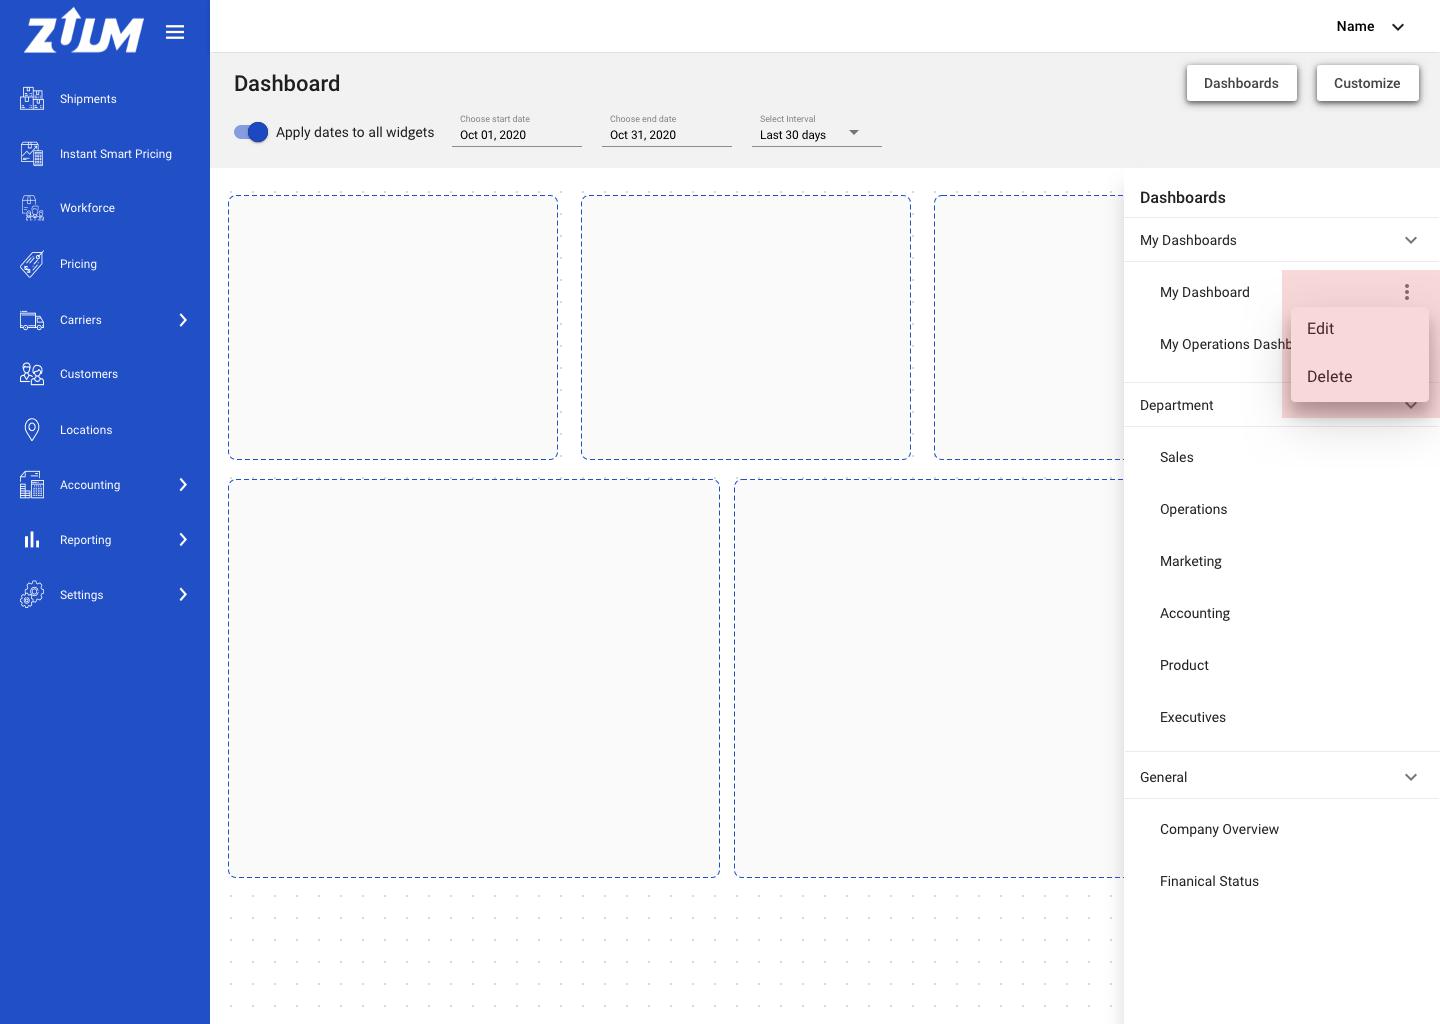
Under the ‘My Dashboard’ sections, a list of dashboard that the user created will be displayed here. Only these dashboard will have the ‘More Options’ icon button.
When the user clicks on the icon, dropdown modal will appear with:
Edit
Delete
Edit - go into edit mode for that dashboard and the user can edit the dashboard
Delete - ability to delete the dashboard
a confirmation modal should appear before the dashboard is deleted.