


[BR] Widgets
Overview
Widgets are small programs that display data or provide shortcuts to other features within the application. They can be placed on a user’s Dynamic Dashboard.
Reusable / Configurable components should be utilized
Link to Widget Templates on Invision
Widget Templates
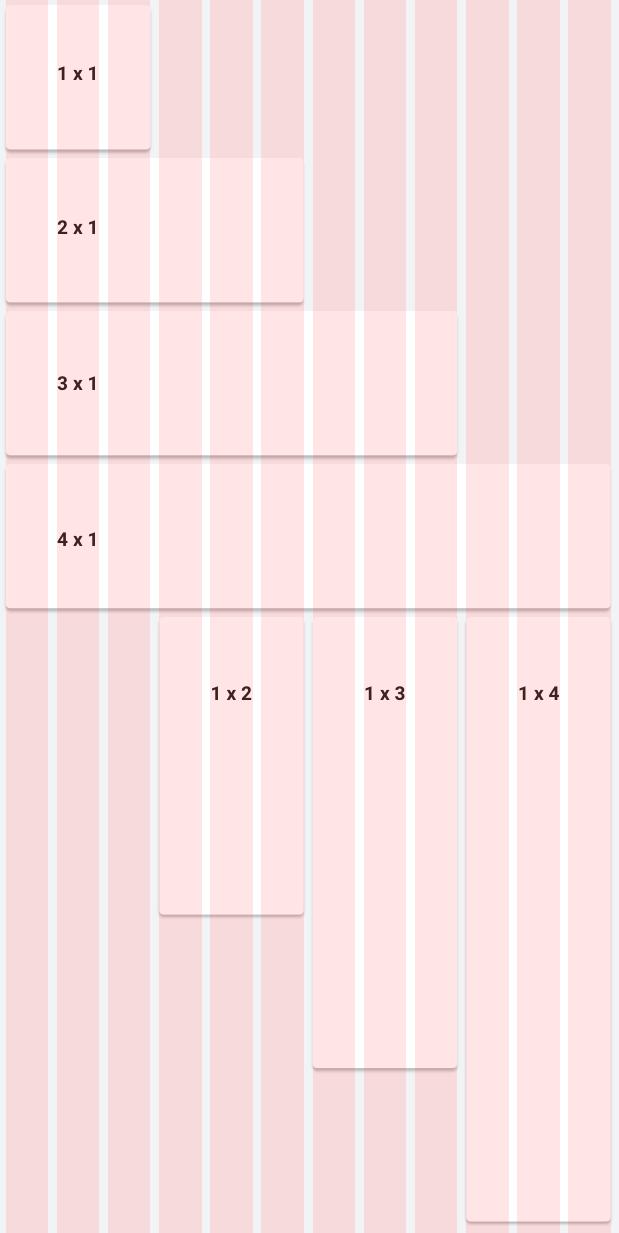
Sizes
Widgets live within the Dynamic Dashboard, and fit within the 12 column grid layout.
The naming convention for widget sizes is W x H, where W represents the width, and H represents the height.
1 = the width of 3 columns
Examples:
1 x 1 - A widget that is 3 columns wide, and the height is equal to 3 columns wide (we will call this 1H)
2 x 1 - A widget that is 6 columns wide, and a height that is 1H
1 X 2 - A widget that is 3 columns wide, and a height that is equal to 2H
Widget Modes
Widgets have a “View Mode” and an “Edit Mode”.
Regular Mode
In regular mode, widgets are blank cards with a title.
Edit Mode
Edit Mode is enabled when the dashboard is in “Edit Mode”.
In Edit Mode, Widgets have an overlay with a toolbar at the top and a semi-transparent overlay that darkens the content of the widget.
The contents of the toolbar depend on the widget “type”
Widget Types
There are currently two widget types:
Basic
Reporting
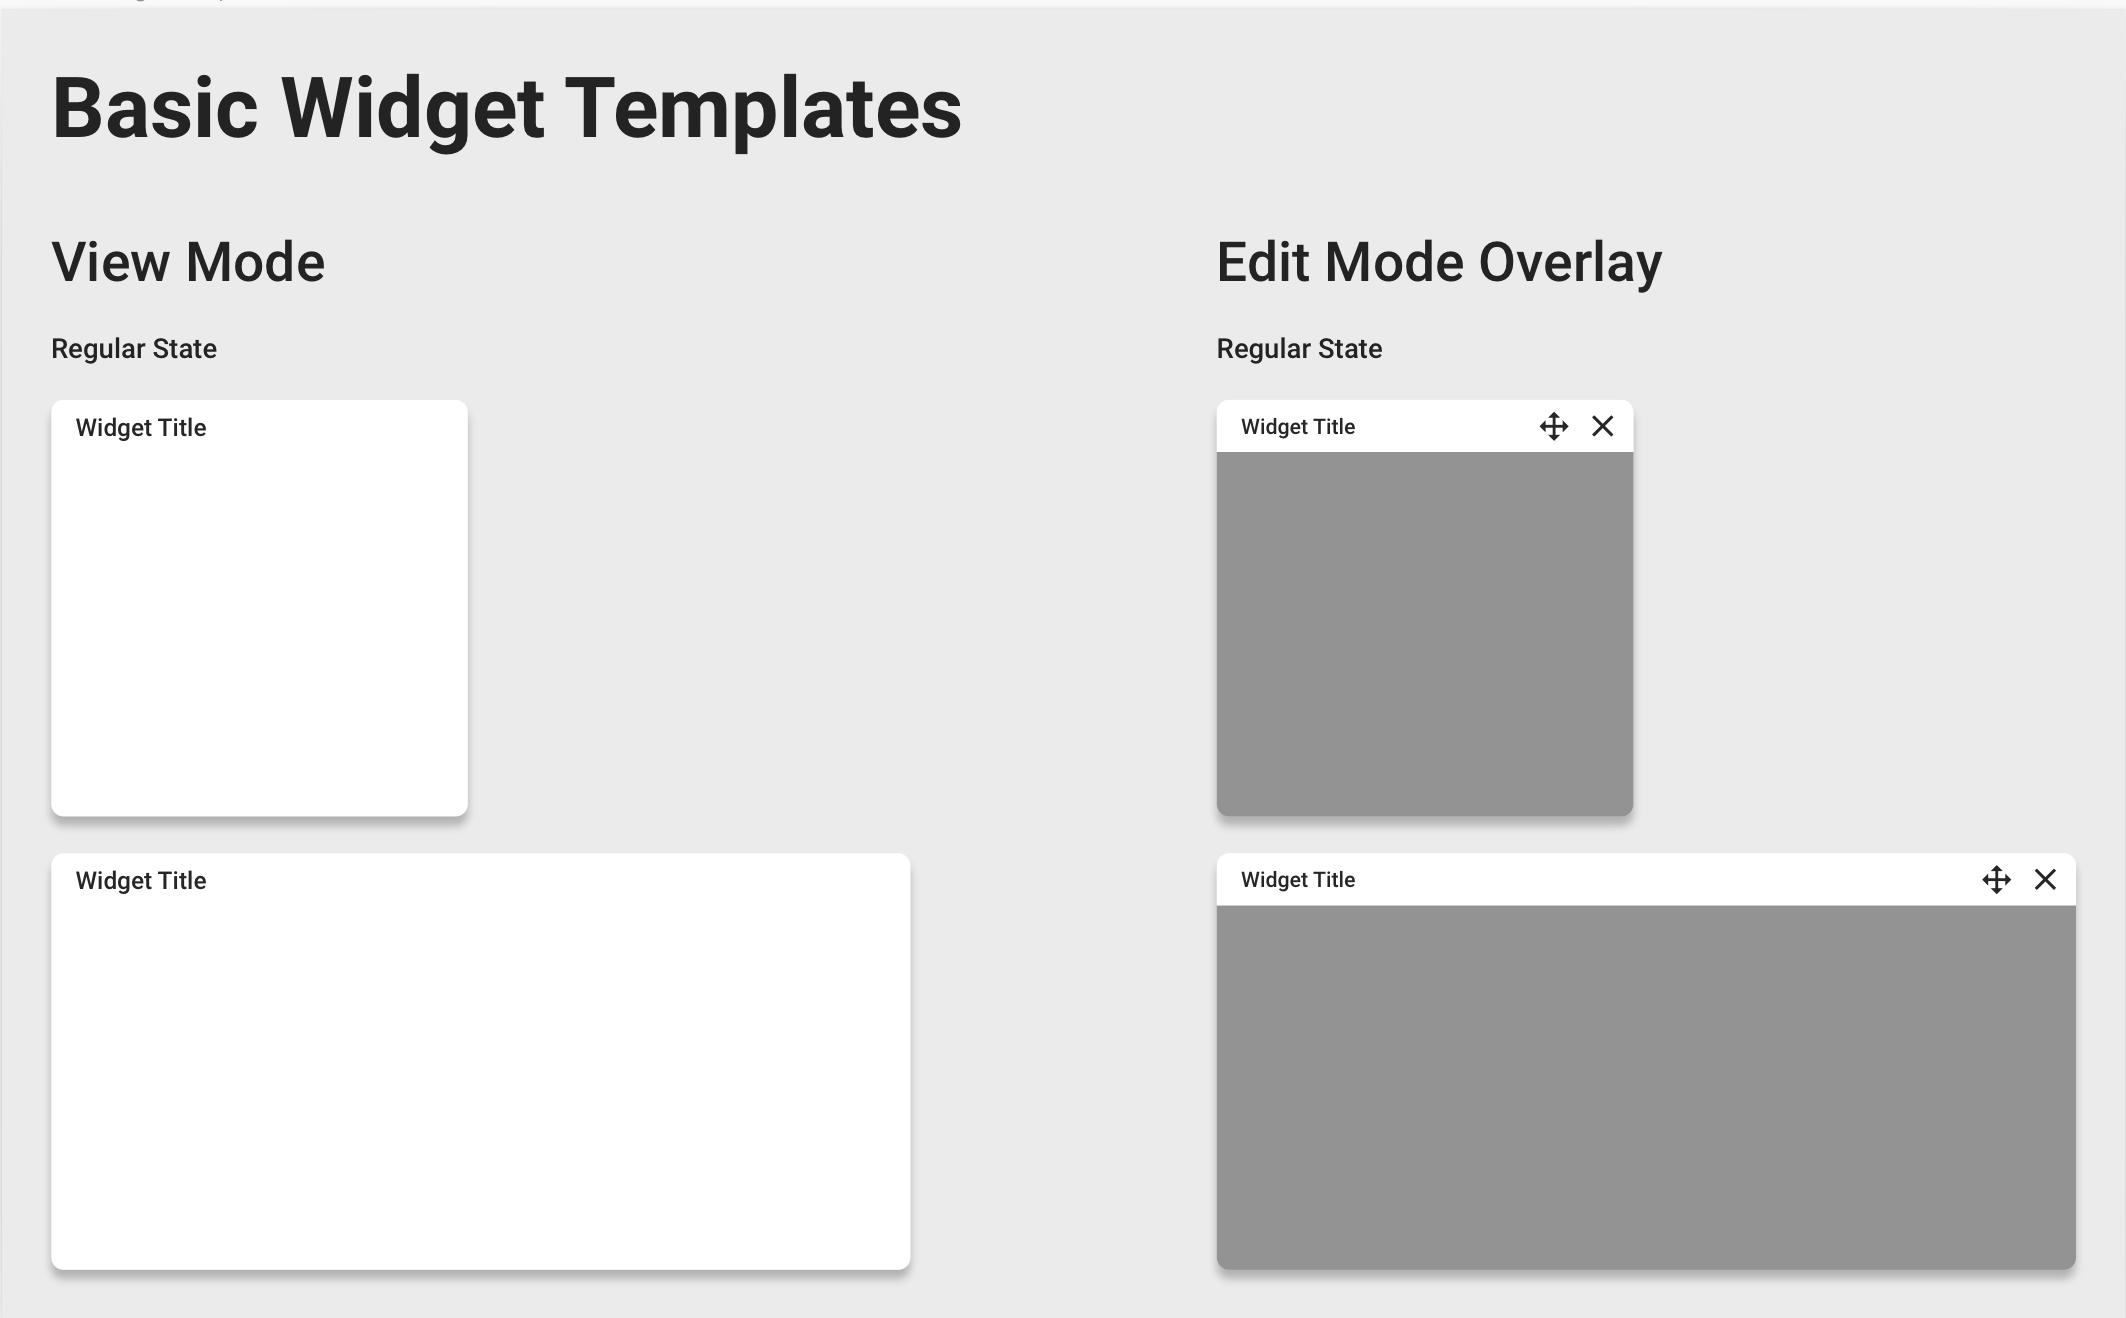
Basic Widget Template
A basic widget is a blank card with a title.
Basic Widget - Edit Mode
The toolbar:
Displays the name of the widget
Has an option to drag the widget
When the user clicks and holds, the widget can be dragged into a different slot within the Dynamic Dashboard, subject to the rules specified in the Dashboard specs.
Has an option to close the widget
When clicked, the widget closes and is no longer displayed on the dashboard
These are called “Toolbar Actions”
Reporting Widget Template
Reporting Widgets display data. Data is typically viewed within the context of a time interval.
View Mode
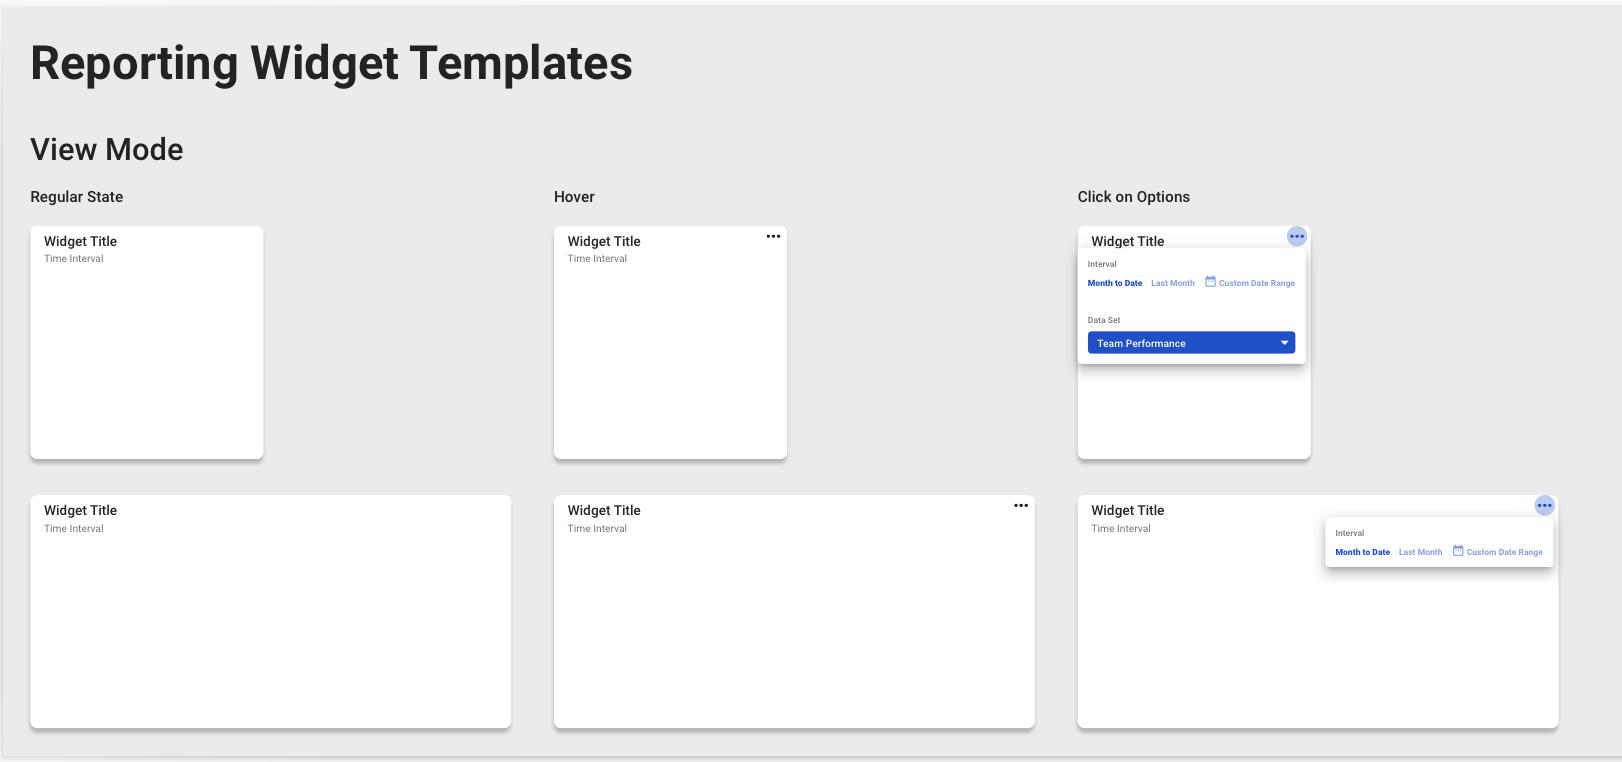
In View Mode, reporting widgets have two states:
Regular State
Hover State
When the user hovers over the widget, an “options” button appears in the top right (three dots)
When the user clicks on this button, a dropdown appears with
Time interval options;
In some widgets, a Data Selector Dropdown (DSD)is also included
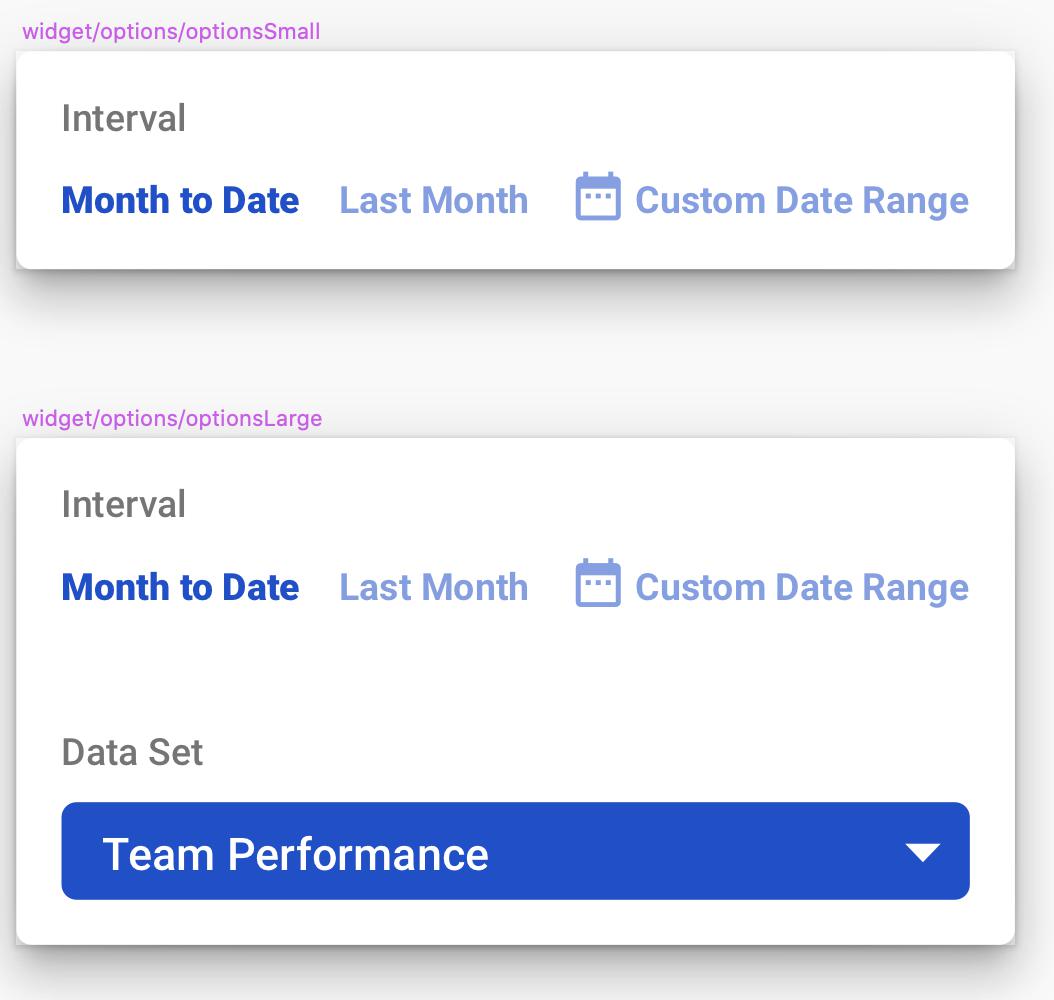
Time Interval Actions allow the user to apply a time interval to the data that is displayed within the widget. These are the options:
Month to Date = Sets the time interval to [“1st Day of Current Month” to “Present Day”]
Last Month = Sets the time interval to [“1st Day of Last Month” to “Last Day of Last Month”)
Custom Date Range = Displays a “Date Range” picker for the user to select a data range to apply to the data.
Please note that the Dynamic Dashboard includes an option to apply a Time Interval to all widgets.
When turned ON, all time-dependent Reporting Widgets should apply the global date range.
When turned OFF, all time-dependent Reporting Widgets should REVERT to the time interval that was previously selected for that widget.
Edit Mode
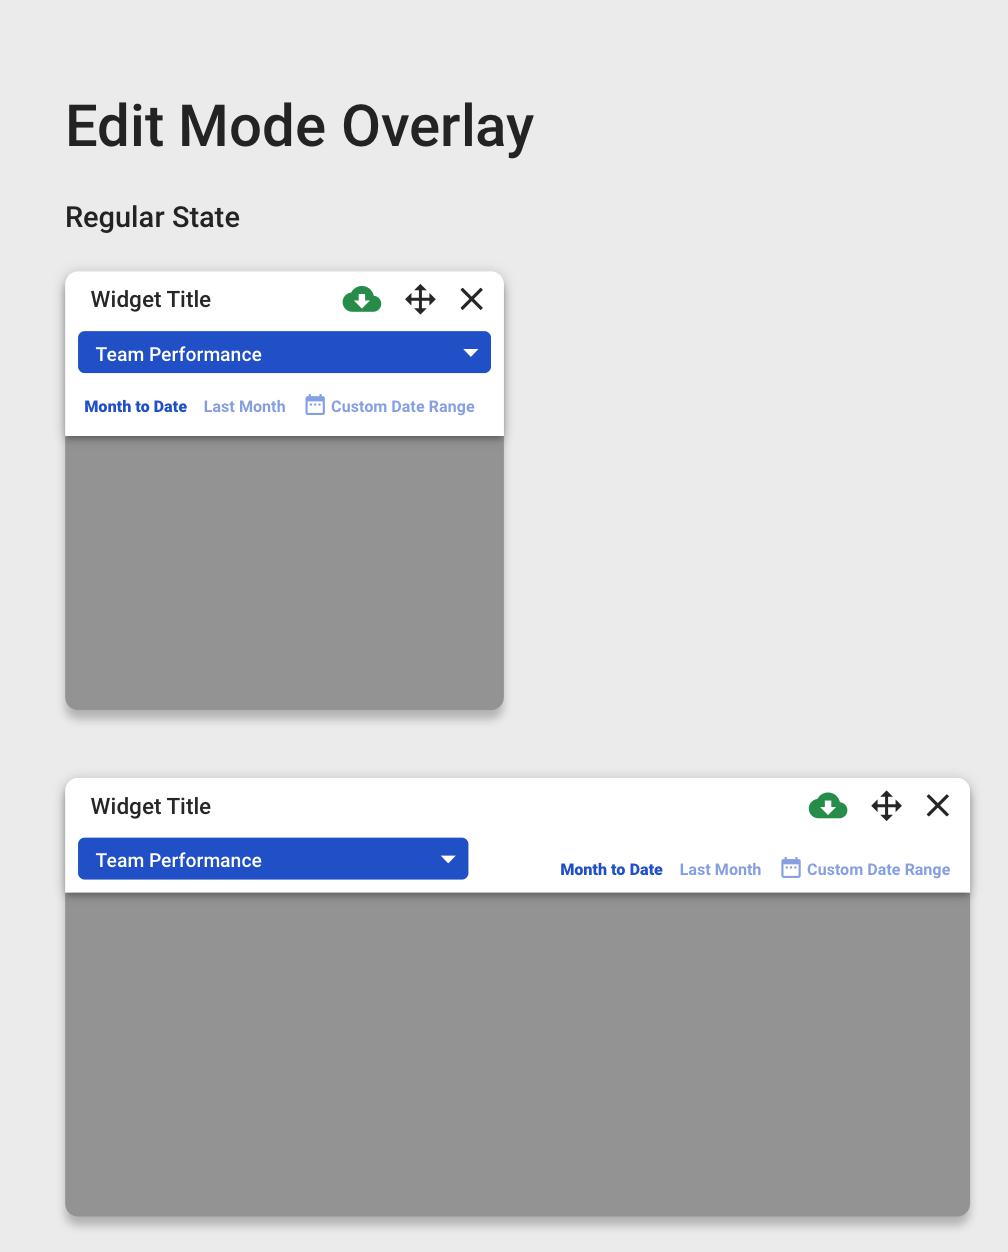
Reporting widgets have additional Toolbar Actions in edit mode. These additional actions include:
Download a CSV of the content/report (if applicable to the widget)
DSD (if applicable)
Time interval options (if applicable)
Note that the toolbar has two sizes - small and large
Data Selector Dropdown - Additional Info
Some reports display data that is aggregated from the performance of a group of individuals. In some cases, the user might wish to view the data that is specific to one individual.
For these types of Reporting Widgets, the Data Selector Dropdown (DSD) is present.
By default, the DSD is set to “Team Performance”. When selected, the options should include individual team members.
Example:
A financial report displays the Revenue, Expenses, Gross Profit, and Margin of the entire sales team. If the user clicks on the dropdown, the options would be each individual sales person.
Selecting one sales person will change the revenue, expenses, etc. to reflect the totals for which that particular sales person is responsible.
Export Options
As a user, I want to export and analyze data.
Therefore, when in Edit mode, Reporting Widgets include a button that allows the user to export the data that is being displayed on the widget as a CSV.
The date range for the exported data should reflect the Time Interval currently selected for that widget.
When Global time interval is turned ON, the export should apply the Global time interval.
Please note that the Time Interval Actions are enabled in Edit mode.
Therefore, a user can change the time interval while in Edit mode, before exporting a report.