


[BR] Best/WorstLanes Report
Document Status | COMPLETE APPROVED BY MO |
|---|---|
Last updated | |
Monday Ticket |
|
Document Owner | |
Designer | |
Developer |
|
QA |
|
Sprint | Reporting 1.0 Clean Up |
Related Document |
|
Design | https://zuum.invisionapp.com/console/share/5X1D5LDX32/480156802 |
Goal
The goal here is to give managers the ability to view which lanes are most profitable and least profitable.
Design
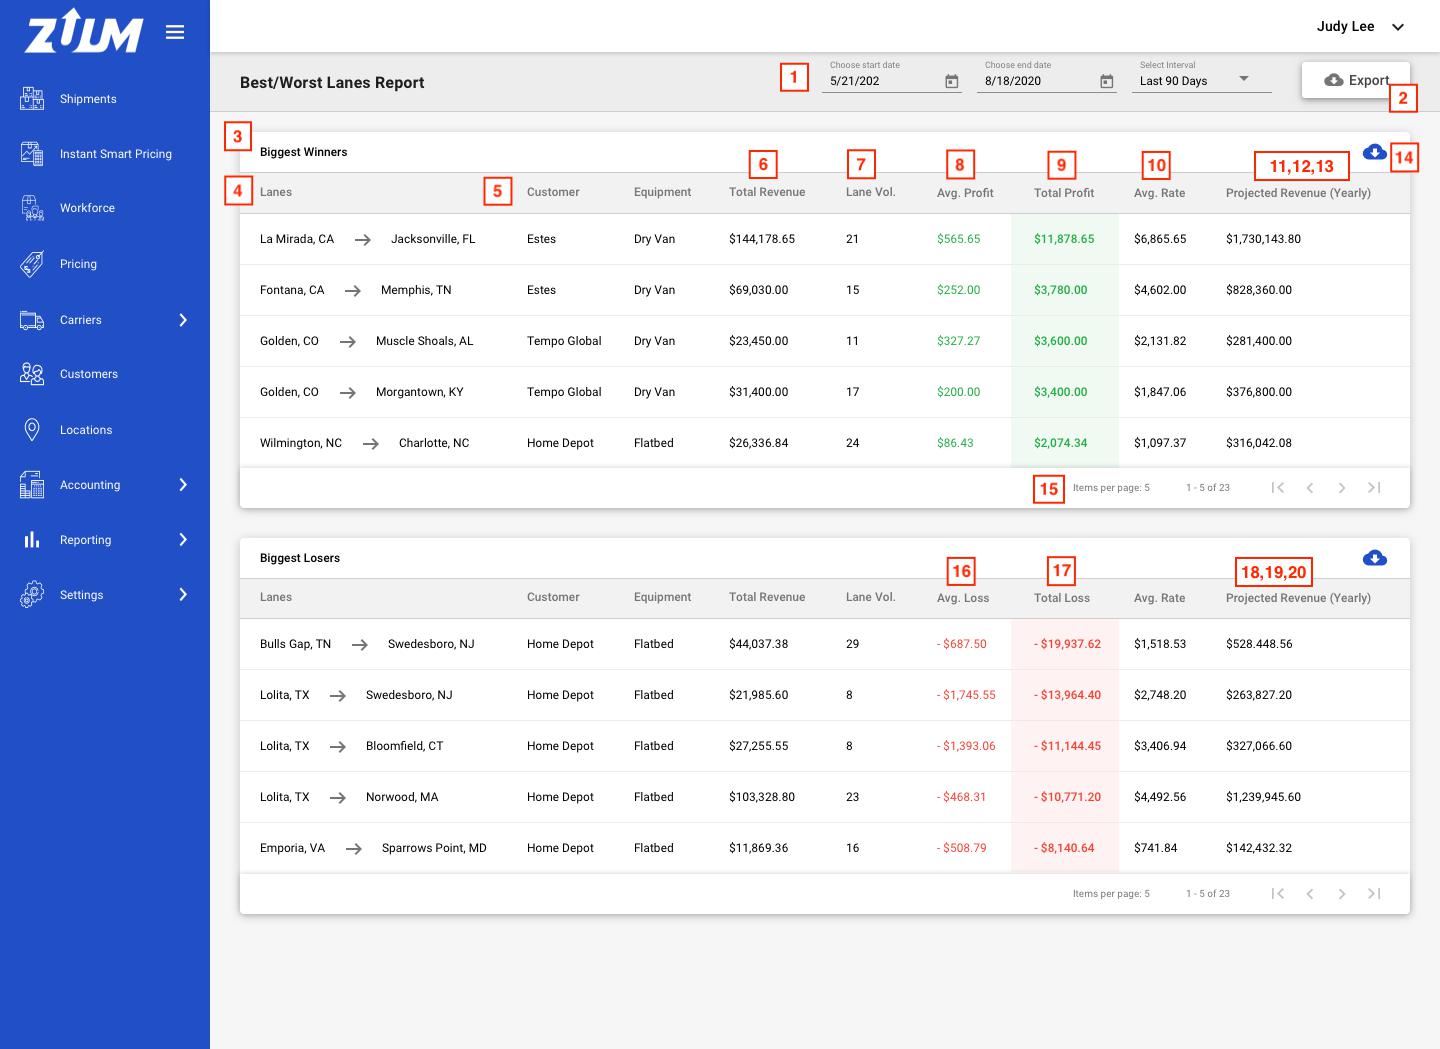
Filters
Start and end date
Select Interval: The selection you see will be the same as the other report pages
These filters will dictate what data is displaying below
Filter button
This button will export this page
Biggest Winners
This group will display the top 5 lanes that are profitable by customers.
This will list the highest “Total Profit” on the top and down
Lanes
This is the lane that we covered for a particular customer
Customer
Customer who are dedicated to this lane
Total Revenue
The total revenue that we received for this lane for a particular customer (#5) in the given interval.
Lane Volume
How many loads we covered for this lane for a particular customer in the given interval.
Average Profit
The average profit we made for this lane for a particular customer in the given interval
Total Profit
Average Profit (#8) x Lane Volume (#7)
Average Rate
The average rate we quoted to a particular customer for this lane in the given interval
Projected Revenue (Yearly)
Total Revenue (#6) x 12
Projected Volume (Yearly)
Lane Volume (#7) x 12
Projected Profit (Yearly)
Average Profit (#8) x Projected Volume yearly (#12)
Export Winner Lanes
Ability to export the winner lanes only
Pagination
Ability to view more lanes that are profitability in the given interval
It won’t display lanes that are loss
Average Loss
The average loss we did for this lane for a particular customer in the given interval
Total Loss
Average Loss (#16) x Lane Volume
Projected Revenue (Yearly)
Total Loss (#17) x 12
Projected Volume (Yearly)
Same as #12
Projected Loss (Yearly)
Average Loss (#16) x Projected volume Yearly (#19)