


[BR] Instant Smart Pricing
Document status | COMPLETED |
|---|---|
Last Updated | |
Document owner | |
Related Documents | |
Design | https://zuum.invisionapp.com/overview/[BR]-Instant-Smart-Pricing-ckcqemh1m0l3g016g1kvqlspn/screens |
Version | V3: |
Overview
Instant Smart Pricing will be a new separate tab on the left-sidebar navigation. This is where brokers will be able to find a price for shippers and carriers. Currently, the brokerage are getting this information on the DAT website (mainly Rateview) but we are integrating it with the Zuum Admin webapp, so they dont have to leave the page.
The page has been updated with the latest iteration
A - Long-Term Pricing
A1 As a user, I can view the Instant Smart Pricing page.
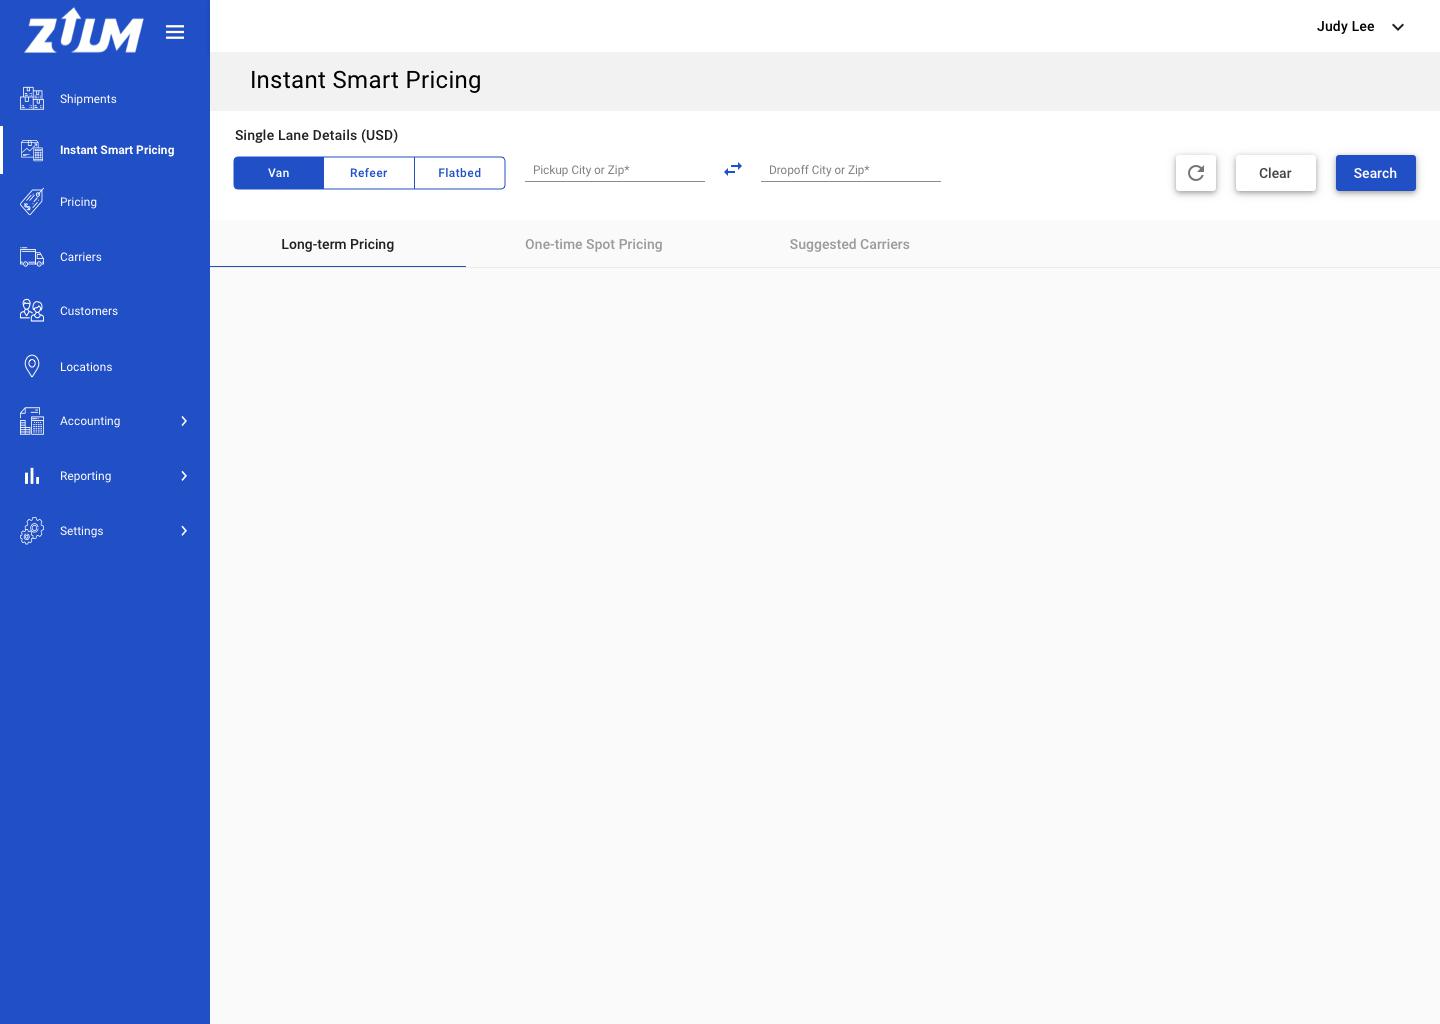
The user can select the truck type on the segmented button. Options are:
Van, Refeer, Flatbed
The user can type into the search fields for Pickup location and Dropoff location. User can type either city name or zip code.
Icon button to swap locations
Three buttons will be available: ‘Refresh’, 'Clear' and 'Search'
Once both search fields are filled and 'Search' is clicked, the page will load with cards and new information.
3 tab menu with:
‘Long-Term Pricing’, ‘One-Time Spot Pricing’, ‘Suggested Carriers’
A timeframe button selection will be available, where the user can select the timeframe of the data to be displayed. Default is 7 days.
A2 As a user, I can search for a lane and view the rates for that lane.
Design: Invision Link | Invision Link - Display Graph
Visual Comparison to DAT: https://zpl.io/bWz384K
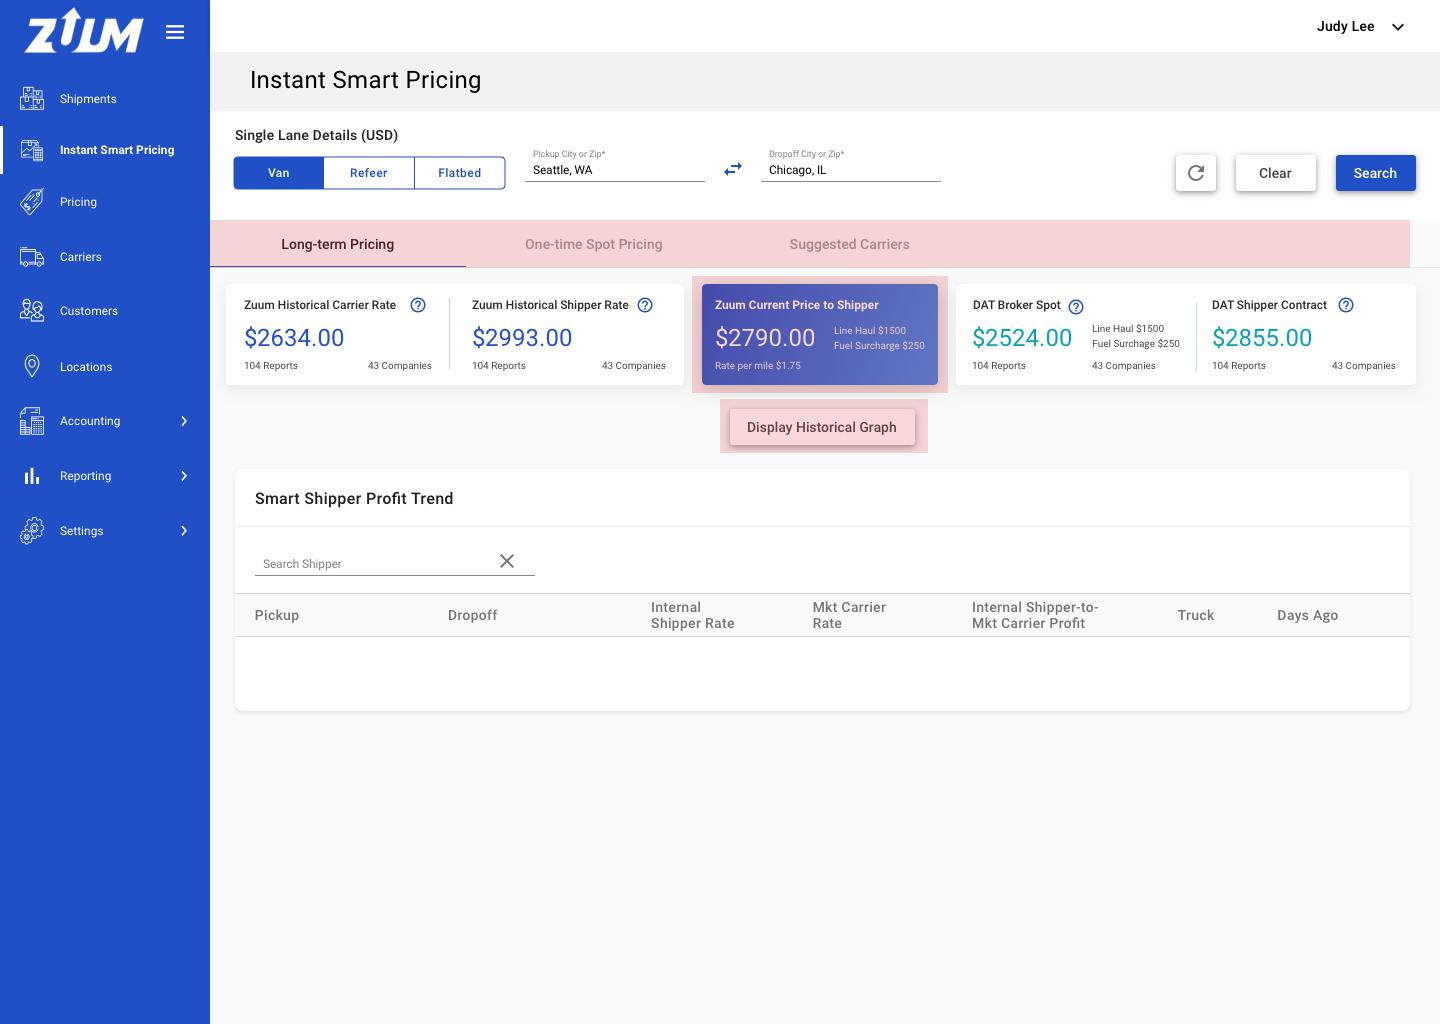
Once the user enters 'Pickup' and 'Dropoff' locations and clicks 'Search' the information displayed are:
Zuum Rates, Zuum Suggested Rate, DAT Rates, Button: 'Display Historical Graph', Smart Shipper Profit Trend table
Zuum Rates are rates within Zuum. There are two categories: 'Internal Historical Carrier Rate' and 'Internal Historical Shipper Rate' **NOTE we have this data in the Reporting Section**
'Internal Historical Carrier Rate' = displays the average rate Zuum paid carriers for that particular lane
'Internal Historical Shipper Rate' = displays the average rate customers paid Zuum for that particular lane
Below each rate, the number of reports (loads) and the number of carriers/customers will be displayed below
Zuum Current Price to Shipper rate
same algorithm from Shipper App ‘Get Quotes’
DAT Rates are rates from the DAT Rate site. There are two categories: 'DAT Broker Spot' and 'DAT Shipper Contract' **NOTE we will be getting this data from DAT**
'DAT Broker Spot' = displays the average rate brokers paid carriers for that particular lane *refer to visual comparison link*
'DAT Shipper Contract' = displays the average rate customers paid carriers for a year-contract for that particular lane *refer to visual comparison link*
Below each rate, the number of reports and the number of companies will be displayed below
‘Display Historical Graph' will appear below, once the user clicks it the map and the graph will appear
A3 As a user, I can hover on the icon to view more info.
Design: https://zpl.io/VDJQBL3

User can hover over the help icon - hover feature will work the same as current
Hover information text:
'Internal Historical Carrier Rate' = Internal Historical Carrier Rate is the rate paid by Zuum to carriers.
'Internal Historical Shipper Rate' = Internal Historical Shipper Rate is the rate paid by shippers to Zuum.
'Mkt Historical Carrier Rate' = Market Historical Carrier Rate is the rate paid by brokers to carriers and owner operators.
'Mkt Historical Shipper Year Round Contract Rate' = Market Historical Shipper Year Around Contract Rate is the rate shippers under contracts pay carriers that have been negotiated up to a year beforehand.
A4 As a user, I can view the graph with the searched lane, when I click ‘Display Historical Graph’.
Design: Invision Link
Visual Comparison to DAT: https://zpl.io/bWz384K
Image below - comparison to DAT (left) to Zuum graph (right)
same x and y axis on DAT will appear for the Zuum graph
also in the visual comparison link*

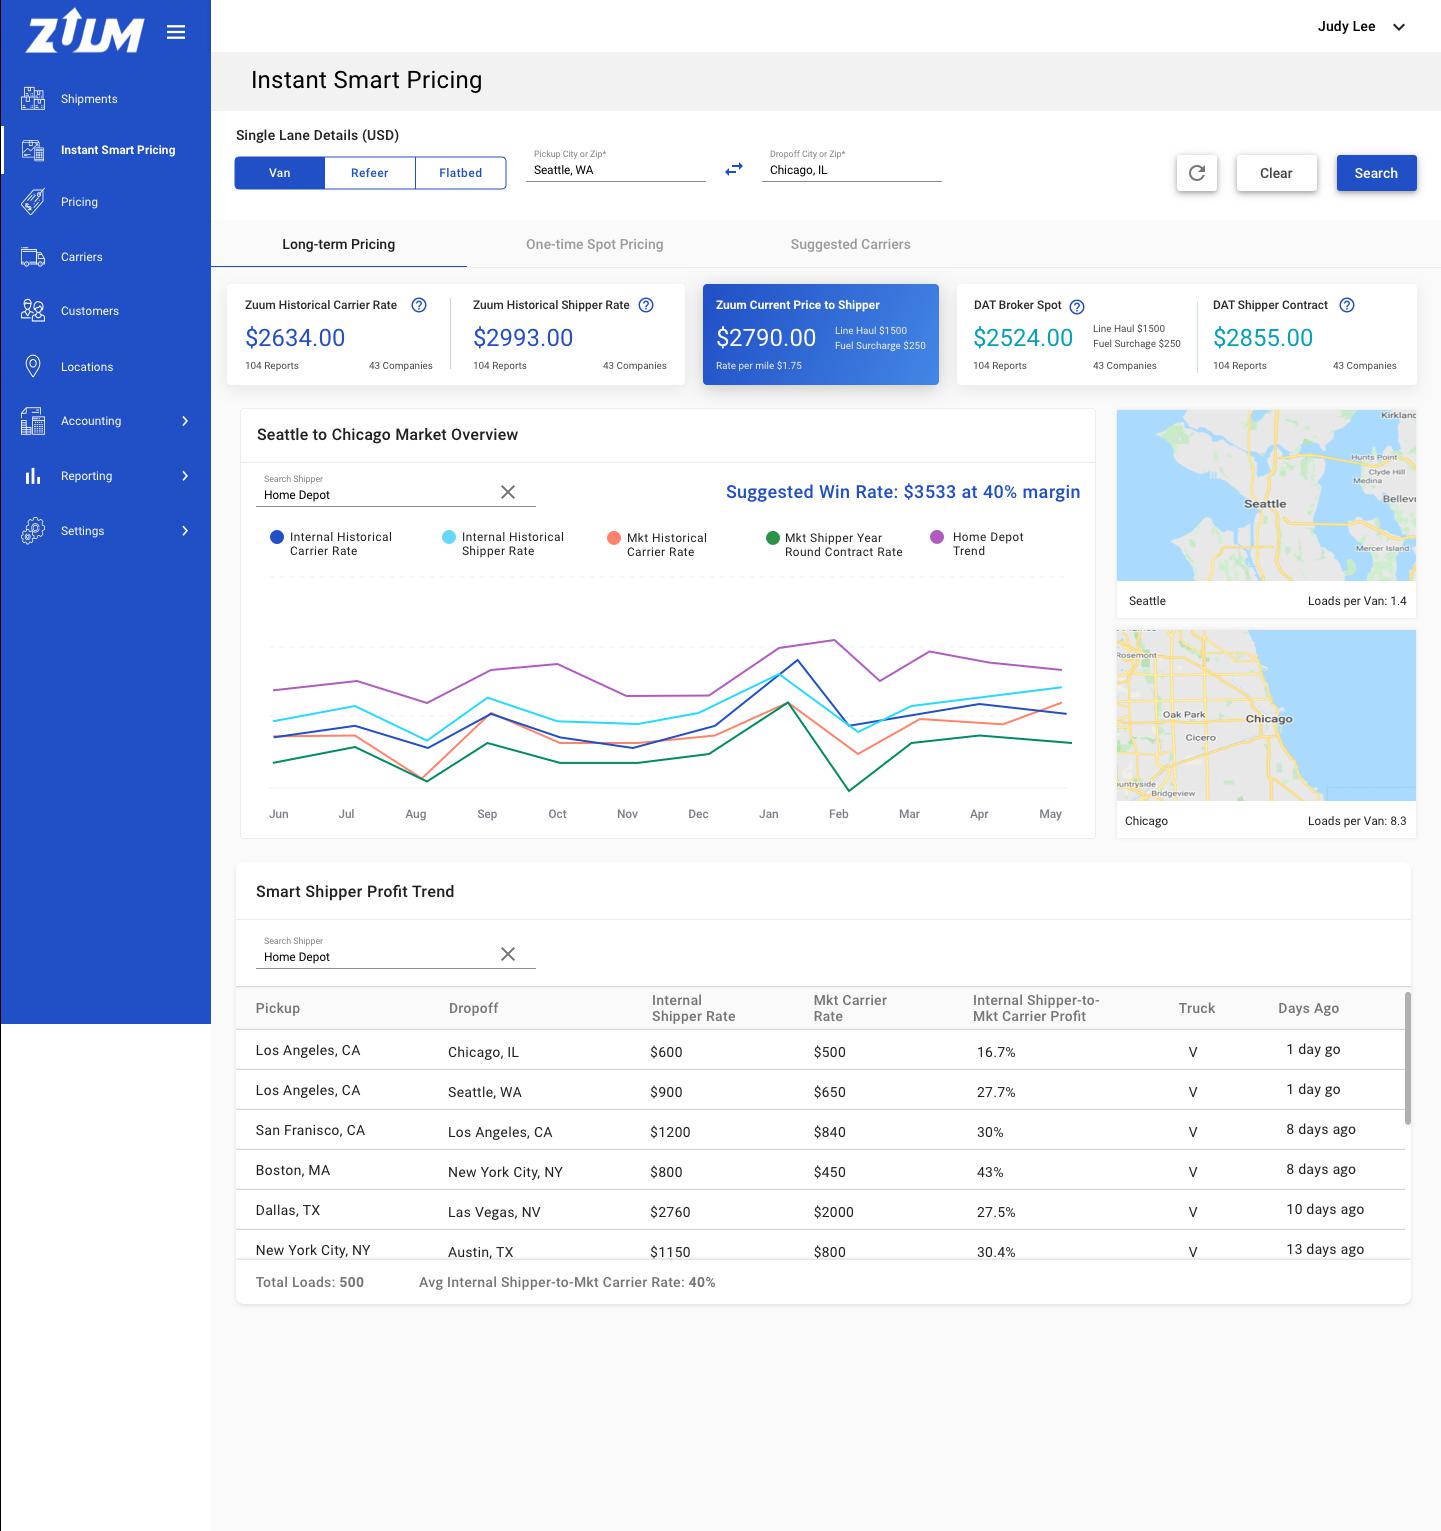
Under the 'Broker Internal Rates' and 'Market External Rates' a graph will be displayed showing a trend of the rates in the past year **NOTE similar to DAT**
The title of the graph will be [PICKUP LOCATION] to [DROPOFF LOCATION] Market Overview.
e.g. Seattle to Chicago Market Overview
Here are 4 rates being displayed, and it is the same as listed above the graph:
Internal Historical Carrier Rate - zuum blue
Internal Historical Shipper Rate - aquamarine
DAT Broker Spot - orange
DAT Shipper Contract - green
The user can hover over the graph lines to view the rate numbers for each month, for that particular data set
The user can click the data set on the legend to hide the line from the graph. The user can click it again to show the data set on the graph.
A search bar is available to the user, within the graph. This search bar allows the user to search for a shipper.
B - One-Time Spot Pricing
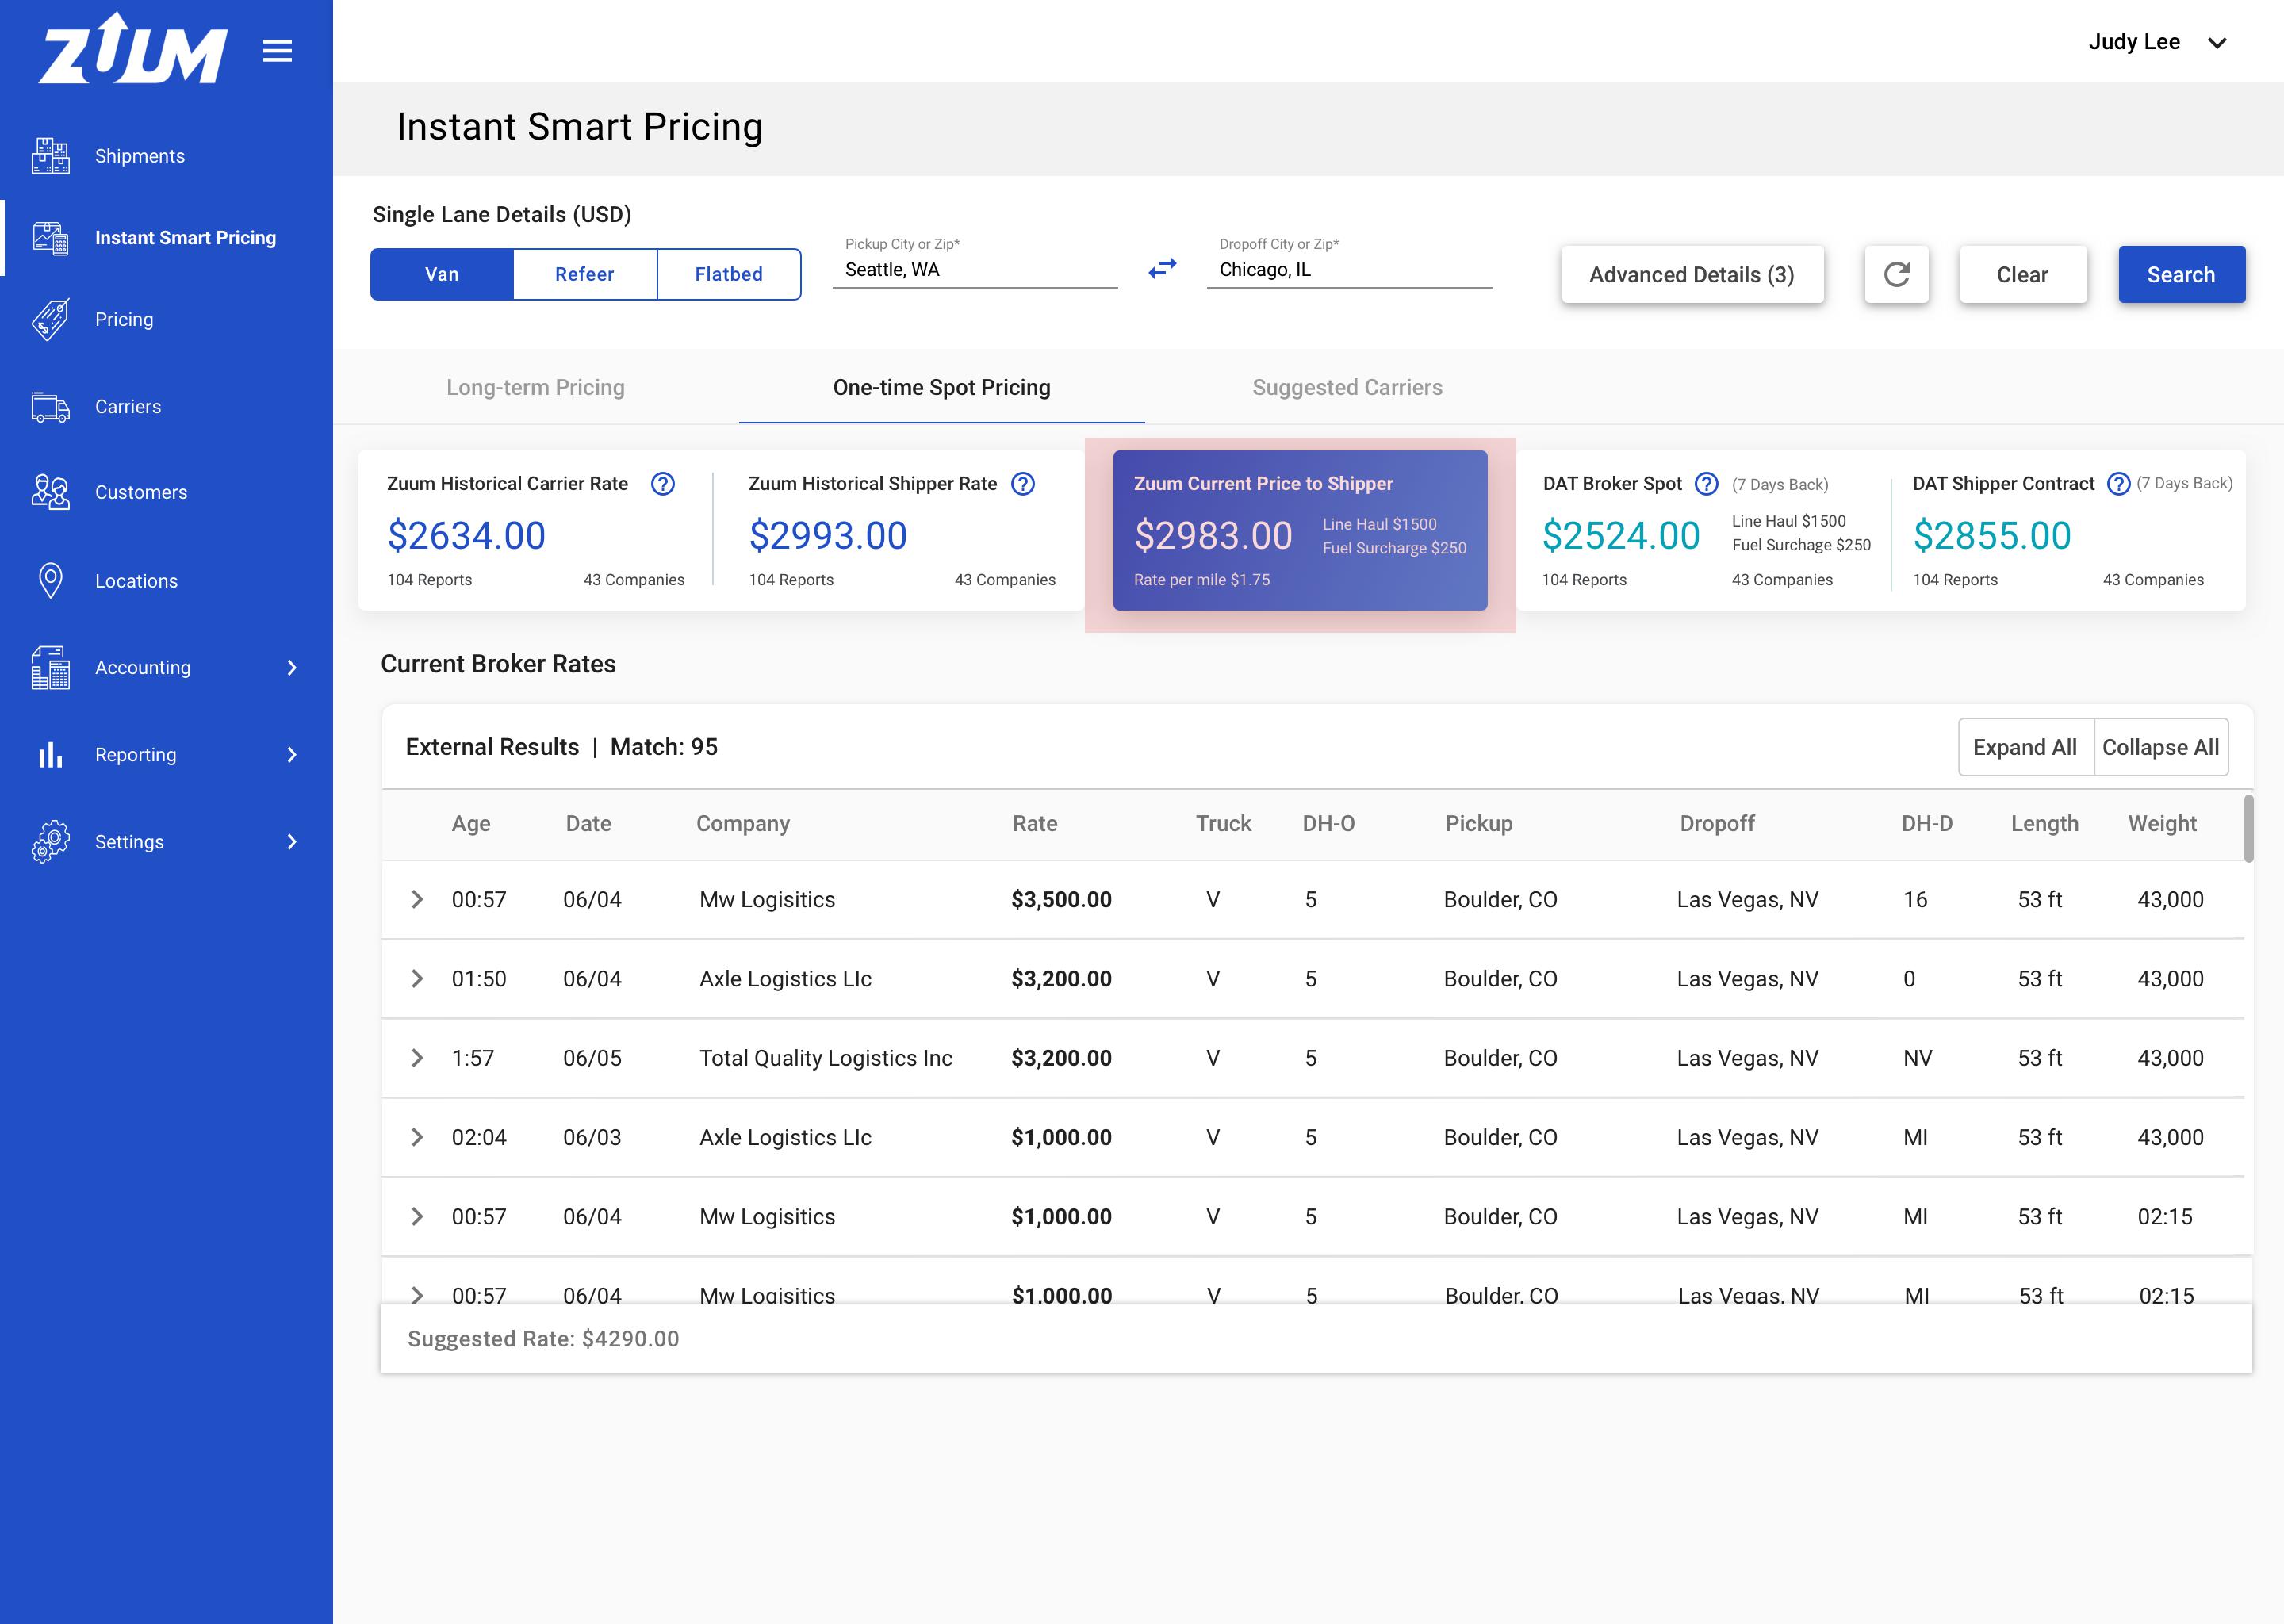
B1 As a user, I can click on the ‘One-Time Spot Pricing’ tab to see the rates other brokers are paying carriers for this lane.
Design: Invision Link
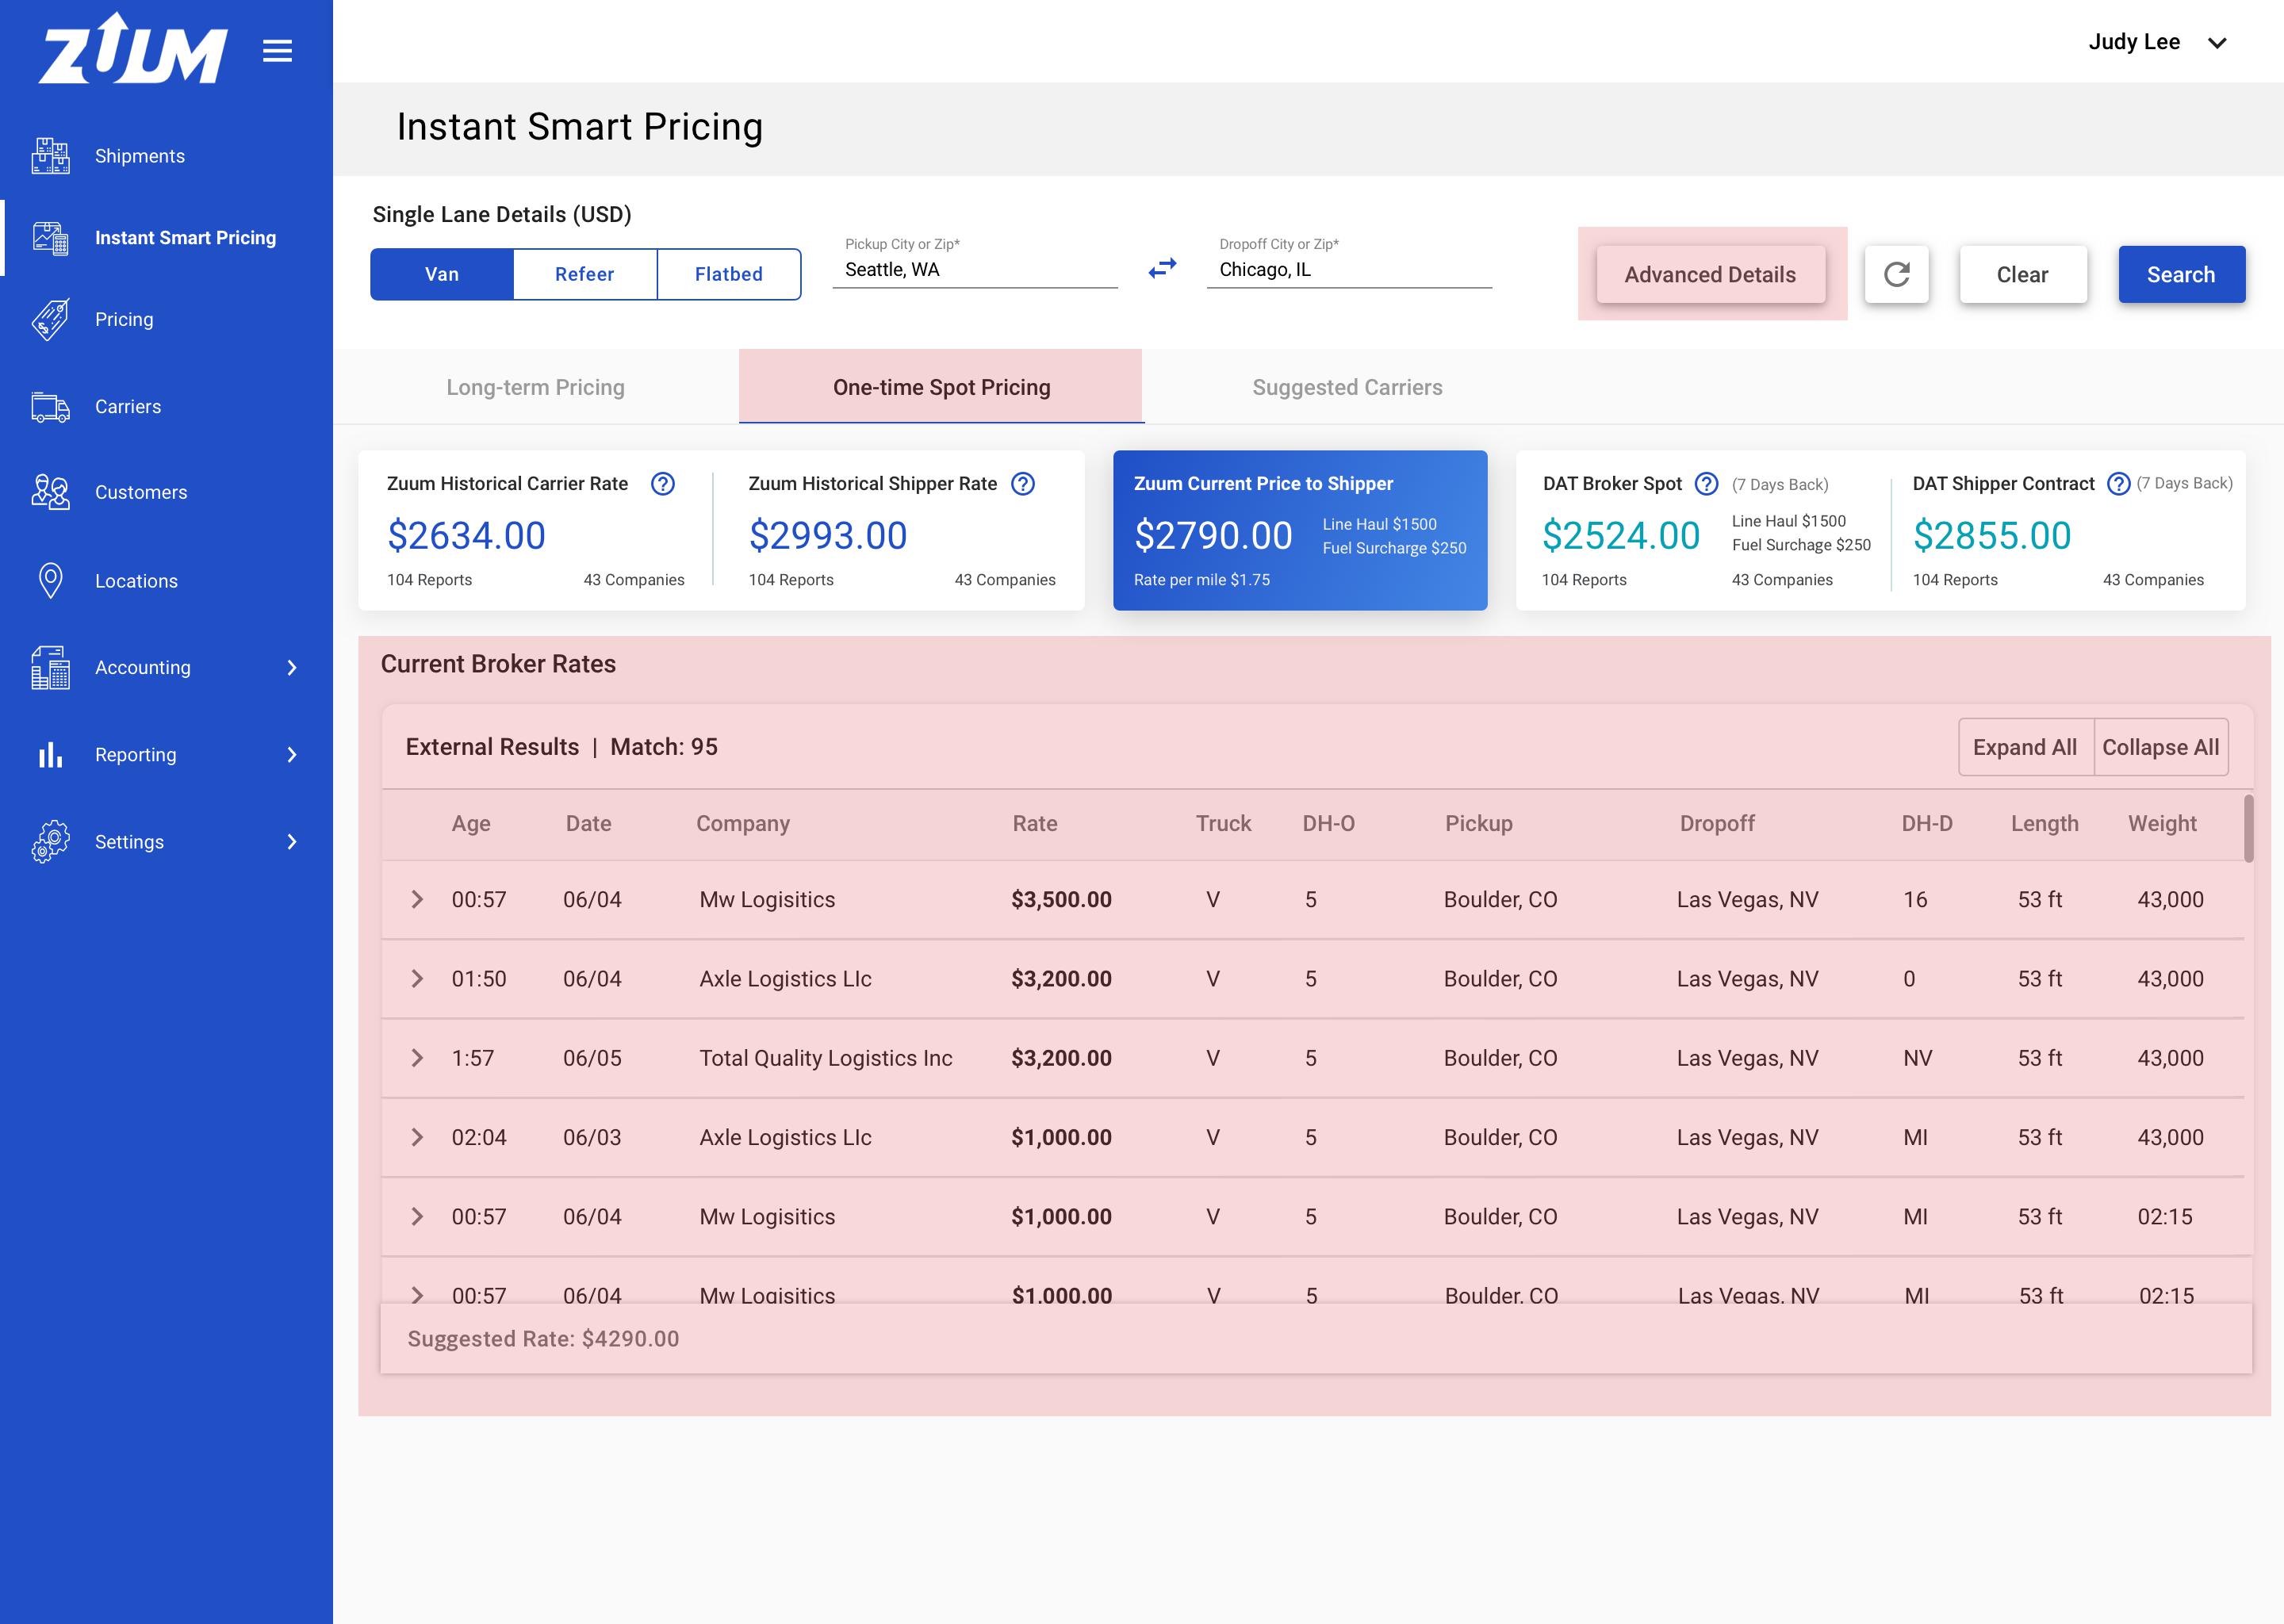
This page will display the same table as in ‘Search Loads’ on DAT - this is where brokers post on DAT looking for carriers and they post the price they are paying carriers
Display 'Suggested Price' at the footer
Formula: highest 3 rates average + 30%
example: (3500+3200+3200)/3 + 30%
'Advanced Detail' button only appear on this page
B2 As a user, I can add advanced details to get a more accurate rate for Shippers
Design (2 screens): Invision Link | Invision Link - Updated Rate
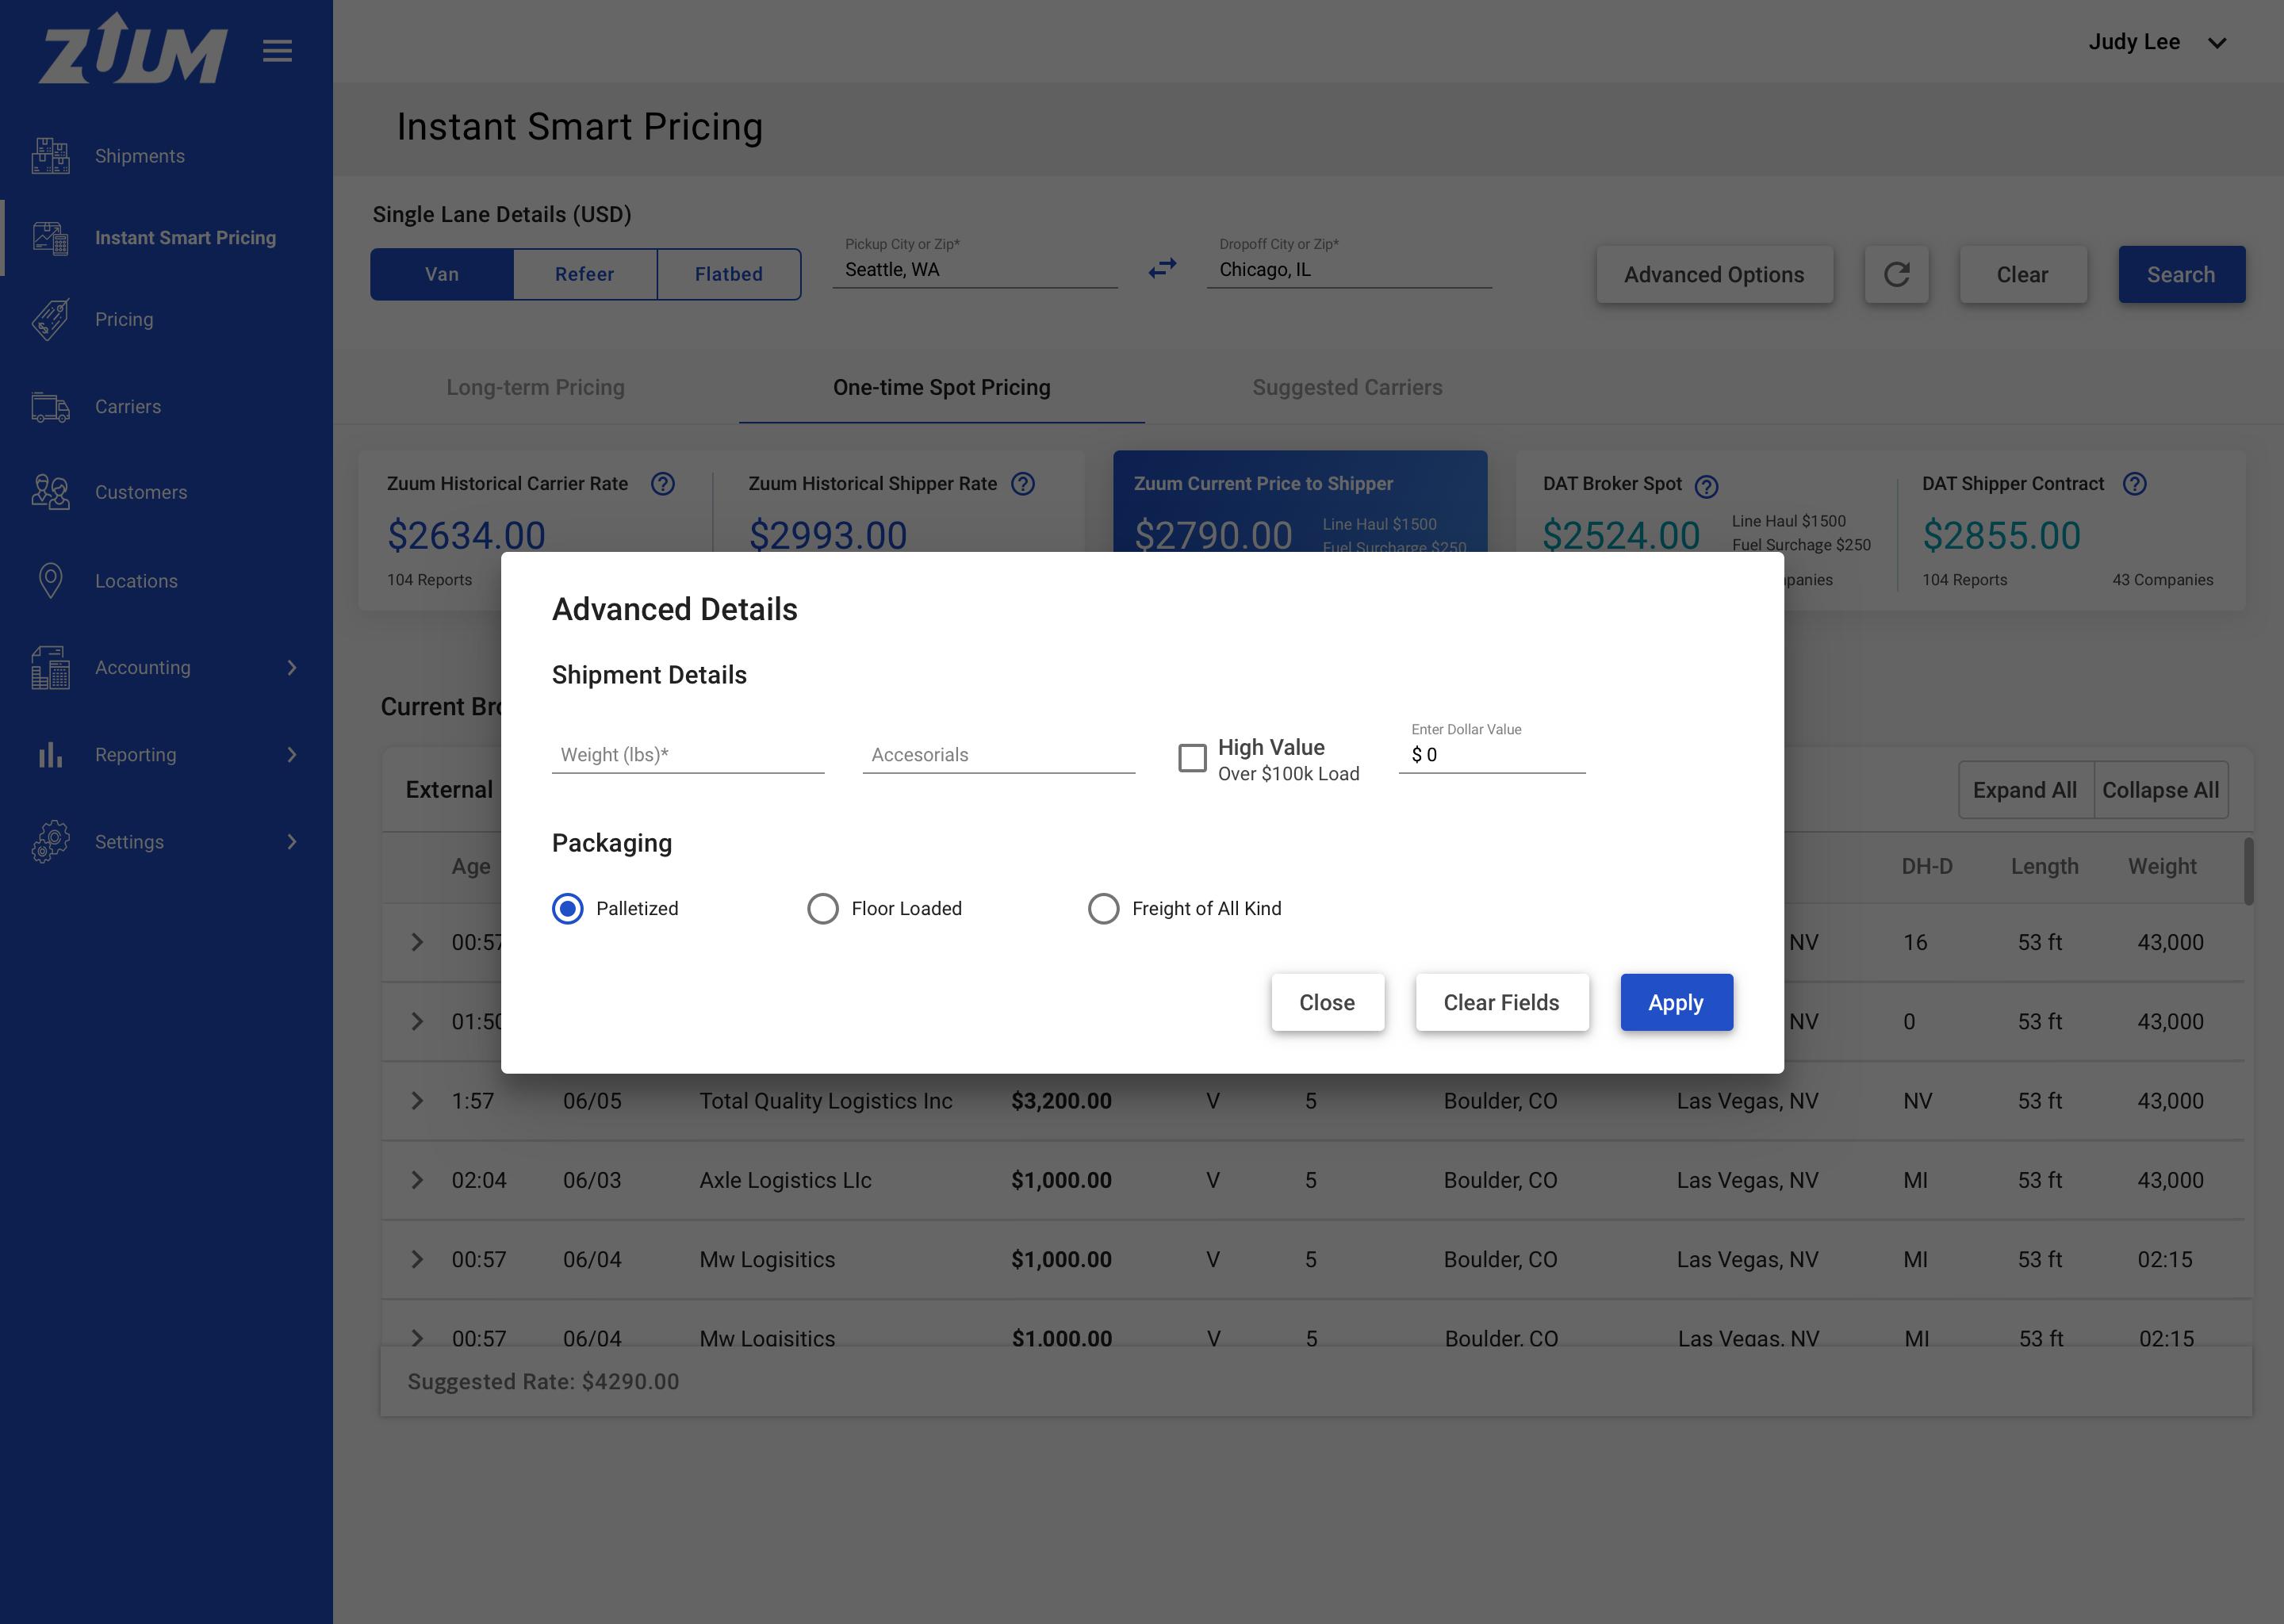
When the user clicks ‘Advanced Details' a modal will appear with more options
same as in Shipper App > Get Quotes (including pickup date)
Once the user applies additional details, the price of the ‘Zumm Current Price to Shipper’ rate will be updated
This display only on this tab
C - Suggested Carriers
C1 As a user, I can click on the ‘Suggested Carrier’.
Design: Invision Link
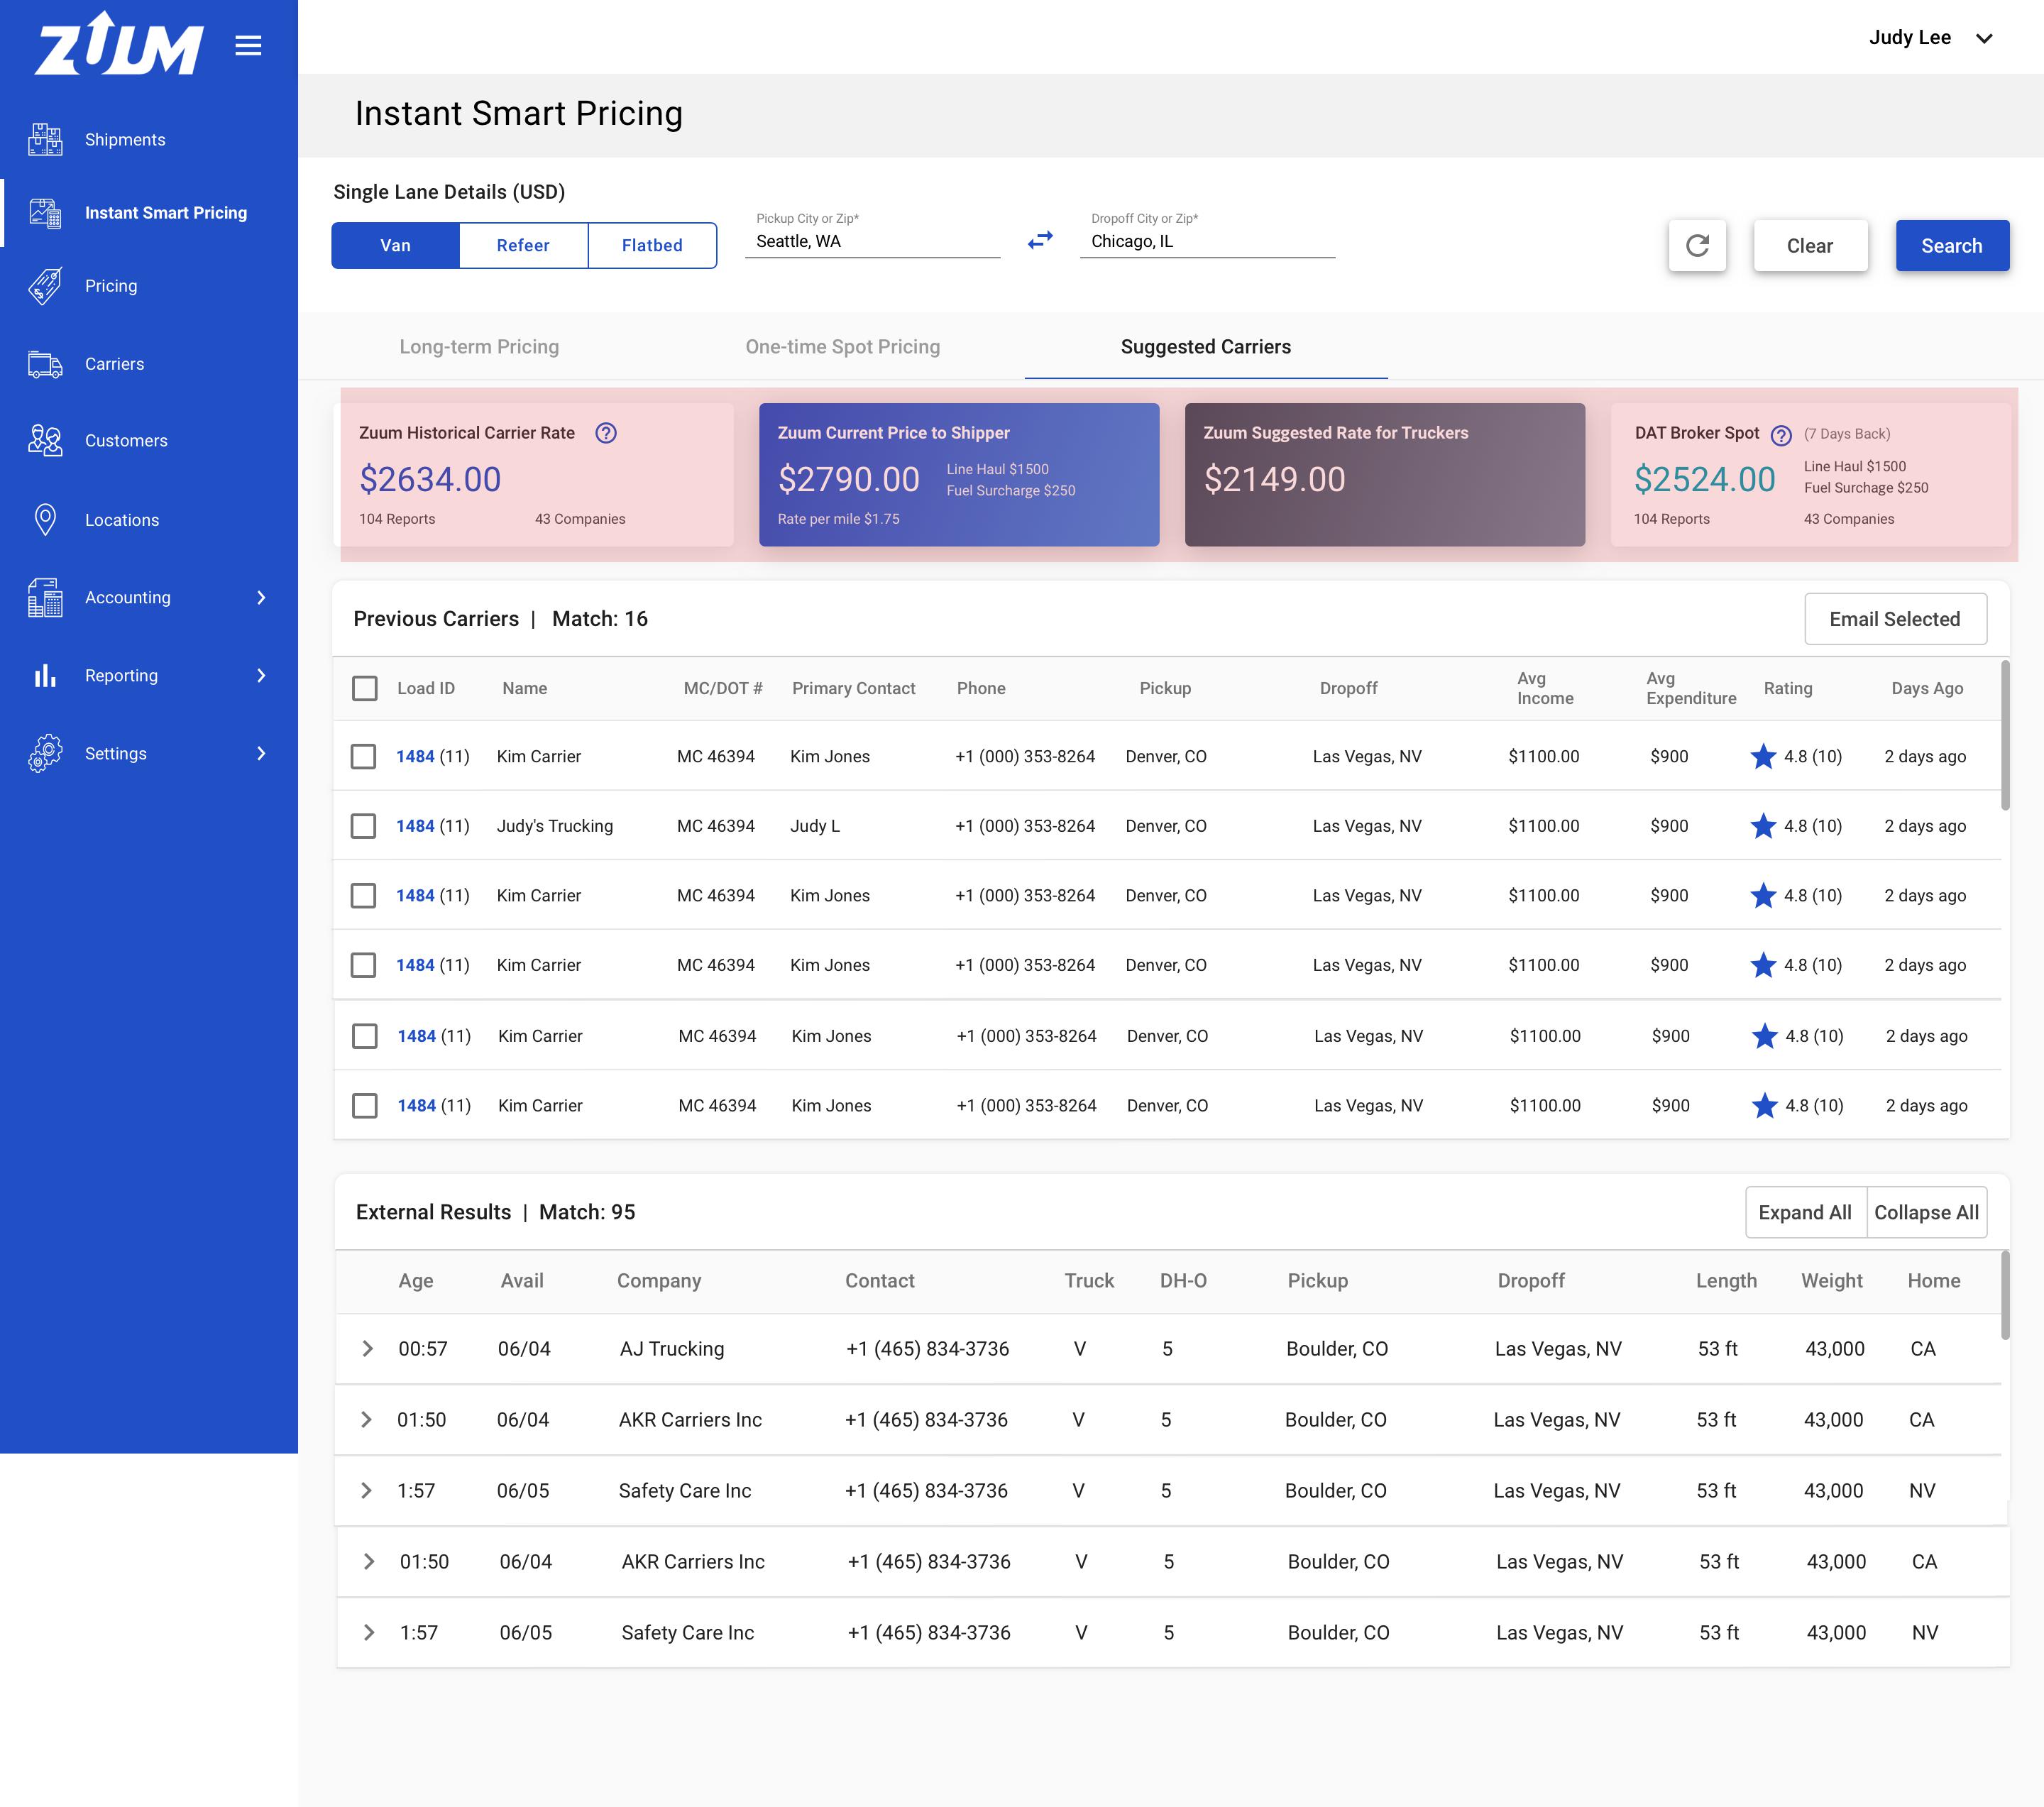
When the user clicks ‘Suggested Carriers' tab, this is the exact same as the other Suggested Carrier & Search Carrier pages
The rates displayed will also be different here:
Only display: Zuum Historical Carrier Rate, Zuum Current Price to Shipper, & DAT Broker Spot
Add a new card: Zuum Suggested Rate for Truckers
this is similar to the Shipment Details > Carrier > Suggested Carrier Rate
Formula: DAT Broker Spot rate - 15%
C2 As a user, I can email multiple carriers.

When viewing the list of 'Internal Carriers', the user can click on the 'checkboxes' for multiple carriers and click the button 'Email Selected' to send an email.
A modal will appear, the information displayed: Title, List of carriers, email subject textfield, email message text field, caption, checkbox to send a copy me on email (default checked), send button and cancel button.
Once the user typed a message and clicked 'Send' a success or error toast message should appear - like how it is currently.
please make sure the emails are sent individually
D - Long-Term Pricing: Search Shipper
D1 As a user, I can search for a shipper in the 'Smart Shipper Profit Trend'.
Design: Invision Link

Below the 'Recommended Carrier' a table will be displayed with 'Smart Shipper Profit Trend'. Here the user can type in a shipper's name and loads related to that shipper will be displayed.
Once a shipper's name has been searched, all loads for that shipper will be displayed below:
Pickup, Dropoff, Internal Shipper Rate, Market Carrier Rate, Internal Shipper-to-Market Carrier Profit, Truck, Days Ago
Footer with: 'Total Number of Loads' and 'Average Internal Shipper-to-Mkt Carrier Rate'
When the shipper's name has been searched, the search bar in the graph will also populate. These search bars are linked.
'Internal Shipper Rate' is the rate the shipper paid Zuum for that particular load.
'Market Carrier Rate' is the rate on DAT that shippers had paid carriers.
'Internal Shipper-to-Mkt Carrier Profit' is the profit gained in percentage for that shipment.
Formula: 1 - (Mkt Carrier Rate / Internal Shipper Rate)
'Avg Internal Shipper-to-Mkt Carrier Rate' on the footer is the average from 5 (above) 'Internal Shipper-to-Mkt Carrier Profit'
D2 As a user, I can search for a shipper in the graph.
Visual Specs: Invision Link

In the graph, the user can also search for a shipper's name in the search bar. When the shipper's name has been selected, the 'Smart Shipper Profit Trend' table will also populate.
These search bars are linked.
When a shipper's name has been searched, a new data set will be added:
On the legend: [SHIPPER NAME] Trend
On the graph: new line = purple
The graph line will be showing the average profit made with the shipper, applied to this lane; showing the trend profit that could be made with this shipper. The 'Avg Internal Shipper-to-Mkt Carrier' in #6 (spec above) in decimal is being applied here.
Formula: 'Historical Mkt Carrier Rate' x (1 + Avg Internal Shipper-to-Mkt Carrier Rate in decimal)
The (1 + Avg Internal Shipper-to-Mkt Carrier Rate in decimal) is being applied to each x axis (e.g. Rate data for May, Rate data for Apr, etc)
D3 As a user, I can see the Suggested Win Rate for this shipper and lane.
Visual Specs: Invision Link

Wherever a shipper's name has been searched, since both search bars are linked, a 'Suggested Win Rate $ at % margin' will appear on the graph, right-side of the search bar.
Formula for the 'Suggested Win Rate':
'Mkt Historical Carrier Rate' x (1 + Avg Internal Shipper-to-Mkt Carrier Rate in decimal)
'Mkt Historical Carrier Rate' in the formula is the SAME rate displayed in the 'Market External Rates' container
The % margin is the SAME percentage as 'Avg Internal Shipper-to-Mkt Carrier Rate'Requirement