


[BR] Tech Reporting Widgets
Overview
The Tech Reporting widgets include:
Report | Type | Data Source |
|---|---|---|
Bugs Report | List | Monday.com |
Velocity Report | List | Monday.com |
QA Report | List | Monday.com |
Sprints Report | List | Monday.com |
Backlog Report | List | Monday.com |
Projects Report | List | Monday.com |
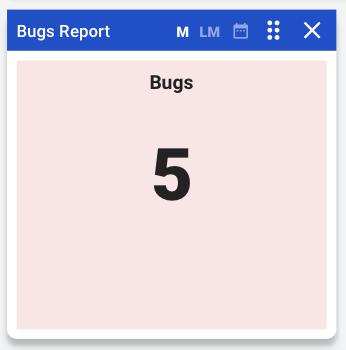
1. Bugs Report
The Bugs report displays the total number of tickets in the “MASTER BOARD - ALL PRODUCTS 1.0” board on monday.com that have the “Stage” set to “Bugs”.
Widget Info:
Widget Size: 1 x 1
Widget Title: “Bugs Report”
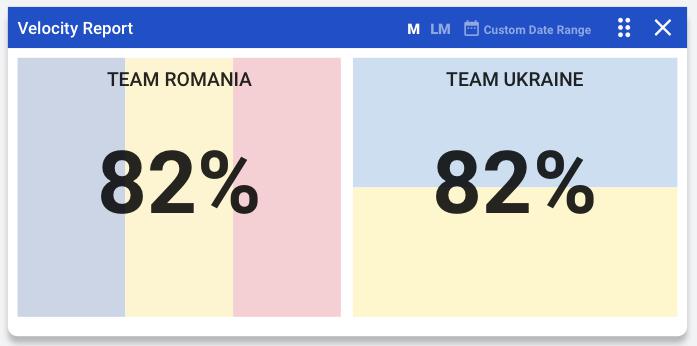
2. Velocity Report
The Velocity Report displays the a percentage that represents the efficiency of each of the development teams.
Widget Info:
Widget Size: 2 x 1
Widget Title: “Velocity Report”
Data:
To calculate Velocity:
Definitions
Assign the following values (“build size value”) to the corresponding build sizes:
XS = 1
S = 2
M = 8
L = 16
XL = 22
An item is completed = when its “Stage status” changes from “In Dev” to “In QA”
Sprint = a time period of two weeks, as set by the project manager
Formula: Sprint Team Velocity =
Calculate the total Build Size Value of all completed items for each group of developers (UA/RO) on the MASTER Board, for each sprint
Team Velocity / Team Member =
Divide the group’s Sprint Team Velocity by the total number of team members
Average Team Velocity =
The average Sprint Team Velocity over three Sprints
Whole Team Sprint Velocity =
The total Sprint Velocity of all dev groups
Average Whole Team Velocity =
Whole Team Sprint Velocity over three sprints
Groups:
Each development team is its own group. Currently, there are two groups:
Team Romania
Team Ukraine
Each group has its own velocity.
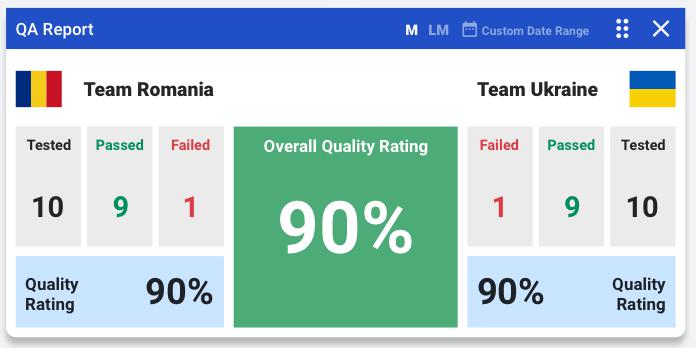
3. QA Report
The QA Report provides displays data on how many tickets have been tested, and whether those tickets have passed or failed testing. The data is used to generate a “quality rating” for each group, and an overall team quality rating.
Widget Info:
Widget Size: 2 x 1
Widget Title: “QA Report”
Data:
Go through this with Jon
There are two groups (Team Romania, Team Ukraine).
For each group, we need to display the following data:
Tested
This is the total number of items/tickets in the “MASTER BOARD - ALL PRODUCTS 1.0” board that were in the “Stage” QA during the selected time interval.
Passed=
The total number of items/tickets that changed Stage from “in QA” to “In House Final QA”
Failed
The total number of items/tickets the “Failed” QA
Quality Rating
= Passed / Tested
The “Overall Quality Rating” = average quality rating of all groups.
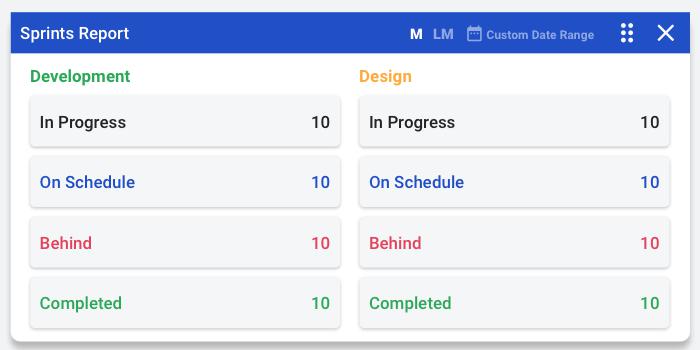
4. Sprints Report
The Sprints Report displays the total number of “Sprints” that are currently “in progress, on schedule, behind, and completed” for the design group and the development group during the selected time interval.
Widget Info:
Widget Size: 2 x 1
Widget Title: “Sprints Report”
Data:
There are two groups (Development, Design).
For each group, we need to display the following data:
In Progress | Number of sprints that have started, but not yet completed |
On Schedule | Number of sprints that are “in progress,” and have not yet passed the planned completion date |
Behind | Number of sprints that are “in progress,” and have passed the planned completion date |
Completed | Number of sprints that have been completed |
Data Source:
- Jon Gryn Which board can we pull this data from? Master Board REVIEW WITH JON
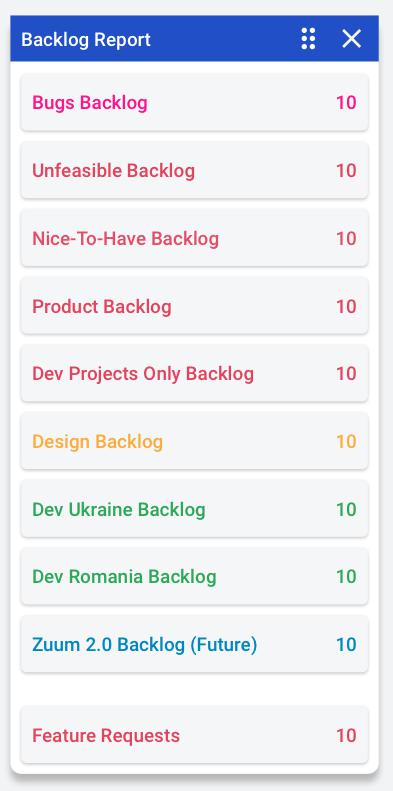
5. Backlog Report
The Backlog report displays the total number of tickets currently in the “backlog” for each of the following groups: product, design, development, QA.
Widget Info:
Widget Size: 1 x 2
Widget Title: “Backlog Report”
Data:
In the “MASTER BOARD - ALL PRODUCTS 1.0” board on Monday, there are the following groups:
Bugs Backlog
Unfeasible Backlog
Nice-to-have Backlog
Product Backlog
Dev Projects Only Backlog
Design (current sprint backlog)
In Dev (Current Sprint Backlog UA Team)
In Dev (Current Sprint Backlog RO Team)
Zuum 2.0 Backlog (future)
Feature Requests
This widget displays a list of the above groups, as well as the total number of items in each group.
The text color for each list item matches the color of the group in Monday.
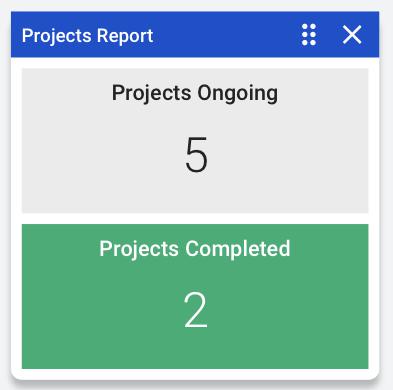
6. Projects Report
The Projects Report displays the total number of projects that are currently “Ongoing” and the total number of projects that have been “Completed.”
Widget Info:
Widget Size: 1 x 1
Widget Title: “Backlog Report”
Data:
DISCUSS WITH JON