


[BR] Carrier History Tab
Document status | COMPLETE |
|---|---|
Last Updated | // |
Document owner | Matan Darey |
Designer | Matan Darey |
Dev Team | RO |
Design Link | https://www.figma.com/file/UNCSKefYI7PhhsFRuefBJA/Carrier-Profile-History?node-id=0%3A1 |
Design File | |
Related Documents | |
Version | V1: // |
Overview
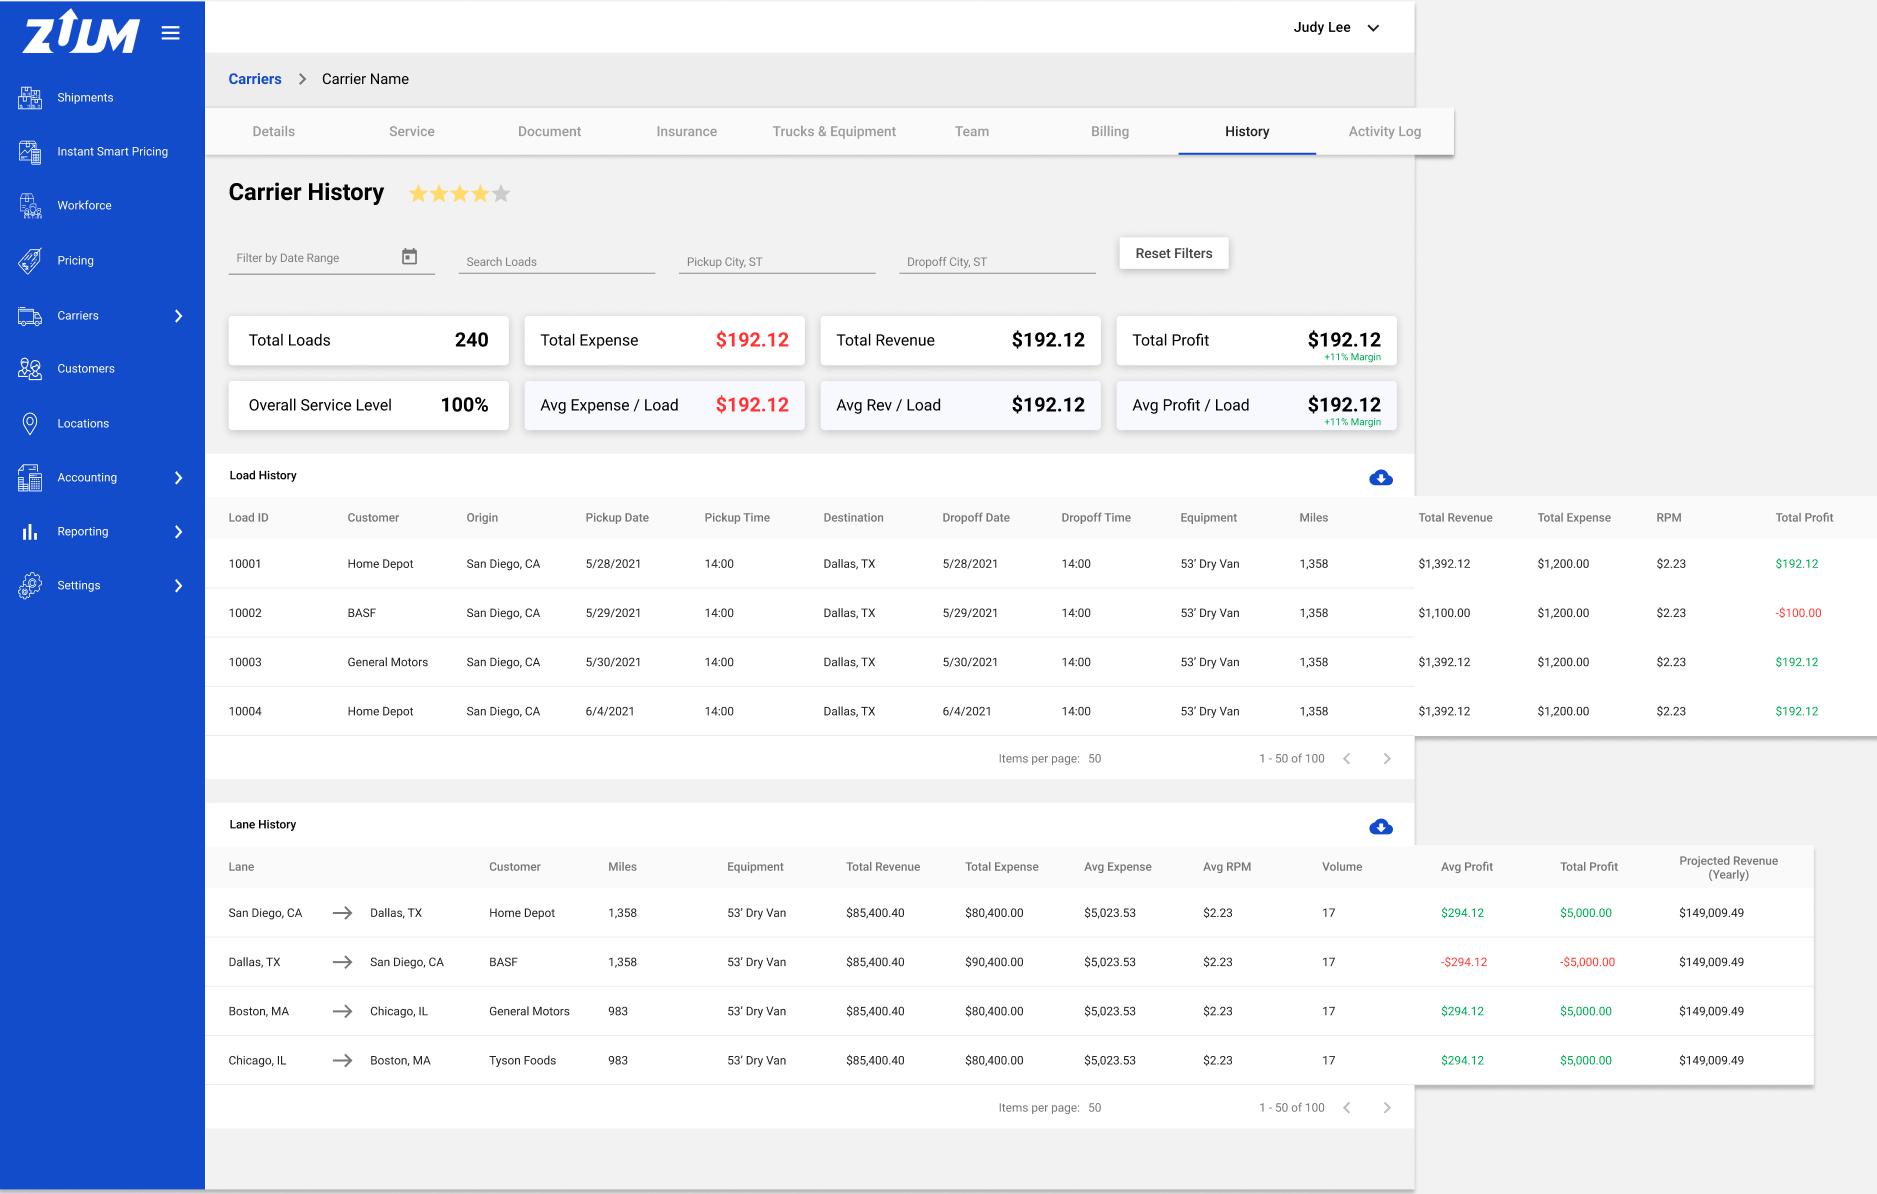
The Carrier History Tab is a section of a Carrier’s profile that provides Brokers with a transaction history for that Carrier.
The transaction history is based on all of the loads that have been tendered to that Carrier.
As a Broker, the transaction history gives me the information I need to decide how much money to offer carriers for loads in the future.
Location
Broker App > Carriers > Carrier Database > Carrier Profile
The Carrier History Tab (1) is a new tab in the Carrier Profile page.
This tab should be placed after the “Billing” tab.
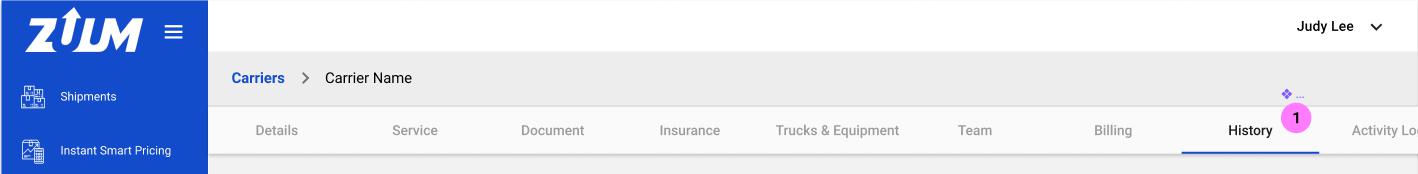
Page Structure
This page has 5 sections:
Heading (2)
Filters (3)
Overall KPIs (4)
Load History (5)
Lane History (6)
Heading

The page heading includes
Title: “Carrier History”
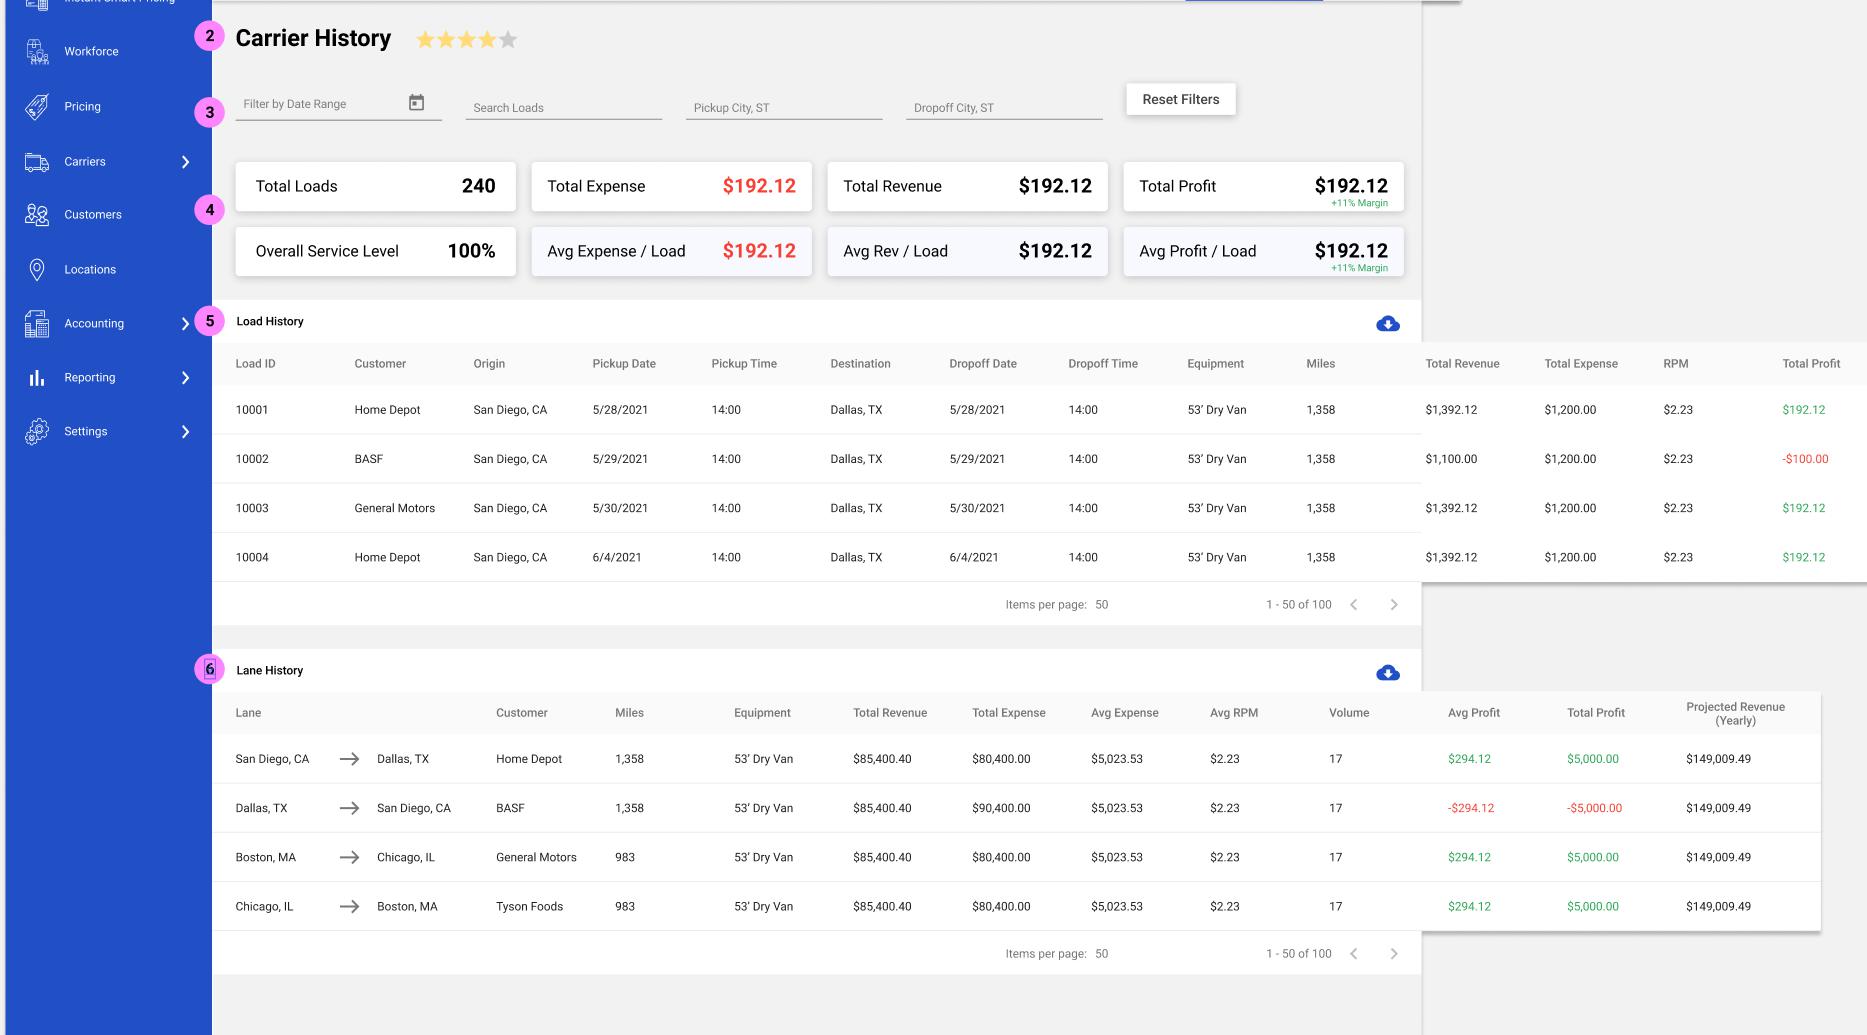
Rating
This is a star-rating out of 5 stars
The filled in stars represent the average of all ratings given to that carrier by operators
This data is available in the “Rating” tab
Stars can be partially filled-in based on the number
The average rating should be displayed as a number to the right of the stars
Filters

The Filters section has
4 filters; and
A button that resets all filters to a blank state
The Filters apply to all of the data displayed on this page, except for the Carrier’s rating at the top.
Filters
Filter by Date Range (Date Picker)
IF the user clicks this, THEN there should be a date picker where the user can define a date range
IF the user defines a date range, THEN the data displayed on this page should only show results for loads where the dropoff date is within the date range that was defined.
Search Load ID (text input)
This is a text input that filters the loads by Load ID
IF the user inputs a Load ID into this field:
All KPIs should only display data from loads with a matching Load ID
Load History table should only display data from loads with a matching Load ID
Lane History table should only display data from loads with a matching Load ID
IF the user inputs a partial Load ID, THEN all loads that BEGIN WITH the partial Load ID that was input should be displayed
Example: User enters 10
KPIs, Load, and Lane history display data from all of the loads that carrier has been tendered that begin with “10”
Pickup City, ST (text input, google maps API)
This filter allows the user to filter by the Pickup City and State
IF the user start typing, THEN the Google Maps API should be used to auto-recommend a city and state as the user types
IF the user inputs a City and State for this input, THEN
All KPIs should only display data from loads with a matching Pickup City and State
Load History table should only display data from loads with a matching Pickup City and State
Lane History table should only display data from loads with a matching Pickup City and State
Dropoff City, ST (text input, google maps API)
This filter allows the user to filter by the Dropoff City and State
IF the user start typing, THEN the Google Maps API should be used to auto-recommend a city and state as the user types
IF the user inputs a City and State for this input, THEN
All KPIs should only display data from loads with a matching Dropoff City and State
Load History table should only display data from loads with a matching Dropoff City and State
Lane History table should only display data from loads with a matching Dropoff City and State
Overall KPIs
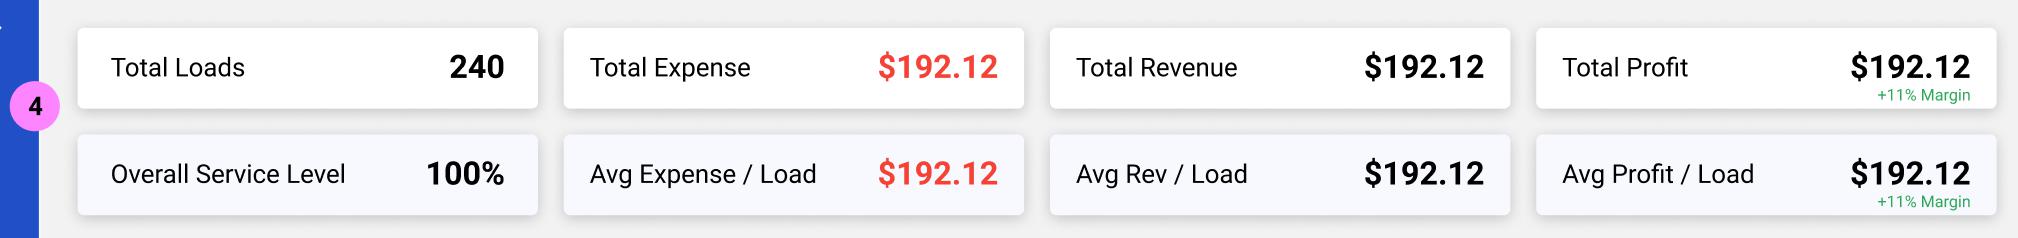
The overall KPIs are a set of cards that display data, generally based on the income and expense of loads tendered to that carrier.
Note: Overall KPI data can be restricted based on the filter settings.
Example: IF user selects date range of 7/1/2021 - 7/31/2021, THEN the overall KPIs will reflect data based on loads that were delivered within the selected date range.
Top Row (totals)
The top row includes the following KPIs
Total Loads = This is the total number of loads that have been tendered to that carrier
Total Expense = This is sum of money that has been paid to that carrier for all of the loads that were tendered to that carrier
Total Revenue = This is the sum of money that was paid by the customer to the broker, for all of the loads that were tendered to that carrier
Exclusions: please exclude the following charges from the revenue calculation:
Detention
Lumper
TONU
Total Profit = [Total Revenue] - [Total Expense]
This card includes the margin, reflected as a percentage
% Margin = [(Total Profit / Total Revenue) * 100]
Bottom Row (averages)
The bottom row includes the following KPIs
Overall Service Level = This shows the overall (or average) service level of that carrier
This data is available in the “Service” tab of the carrier profile (Link: Service Tab )
Average Expense per Load = [Total Expense / Total Loads]
Average Revenue per Load = [Total Revenue / Total Loads]
Average Profit per Load = [Total Profit / Total Loads]
Includes average Margin
Calculation for Average Margin = [(Average Profit / Average Revenue) * 100]
Load History
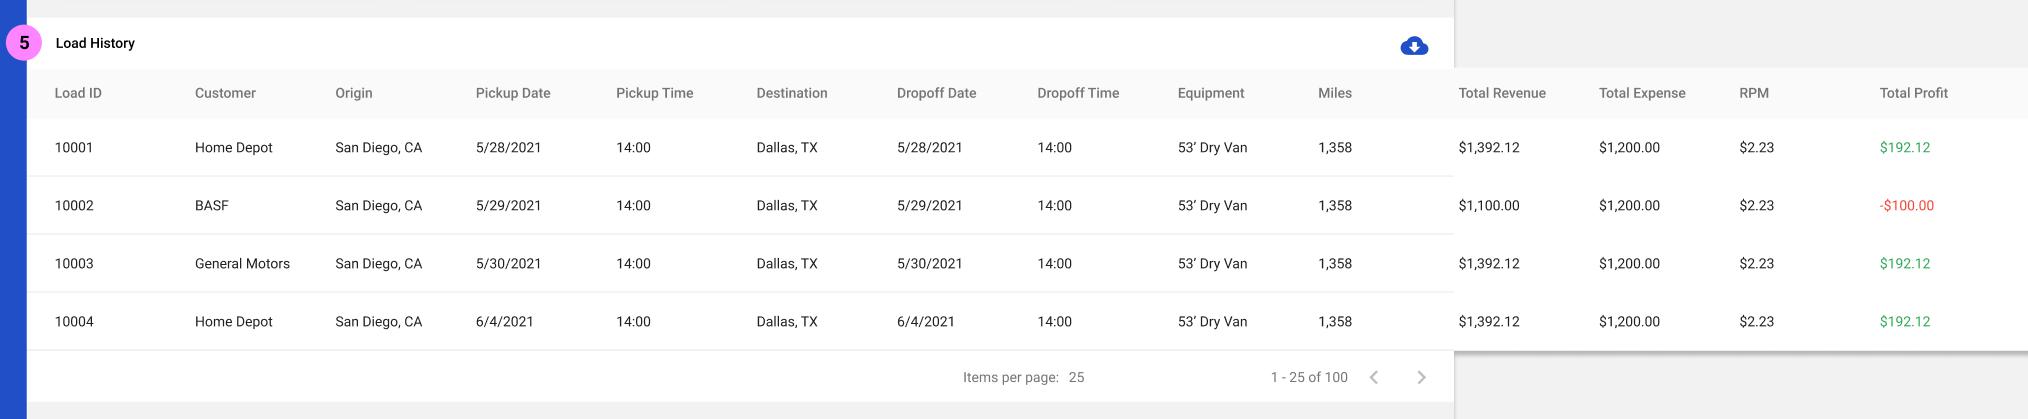
The Load History data table is a table that displays all loads that have been tendered to that carrier.
Each load that has been tendered to that carrier is represented as a row in the data table.
For each row, the data table has the following columns:
Load ID
Customer
Origin = the first stop for that load
Pickup Date
Pickup Time
Destination = the last stop for that load
Dropoff Date
Dropoff Time
Equipment
Miles
Total Revenue = This is the sum of money that was paid by the customer to the broker for this load
Exclusions: please exclude the following charges from the revenue calculation for each load:
Detention
Lumper
TONU
Total Expense = This is the sum of money that was paid to the carrier for this load
RPM (Rate per mile) = [Total Expense / Miles] (this is represented in US currency format)
Total Profit = [Total Revenue - Total Expense]
Lane History
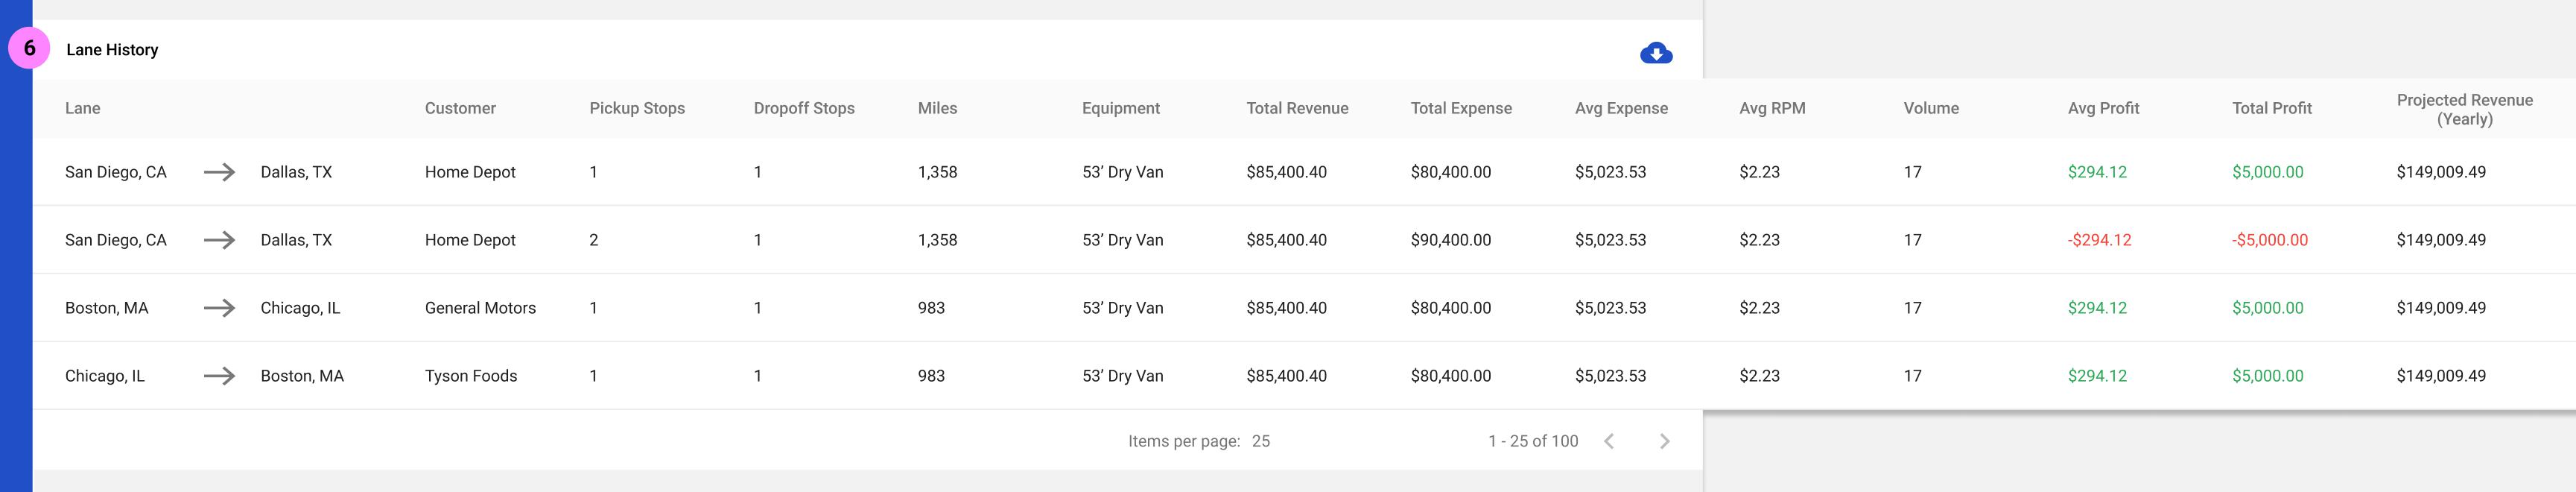
The Lane History data table is a table that displays all lanes that the carrier has done.
A unique lane is defined as = [Pickup City and St, Dropoff City and State, Customer, Equipment, number of pickup stops, and number of dropoff stops]
This data table is almost the same as the data table used in the “Lanes Report” page
Lanes Report in Broker Admin Prod
Lanes Report Specs in Confluence
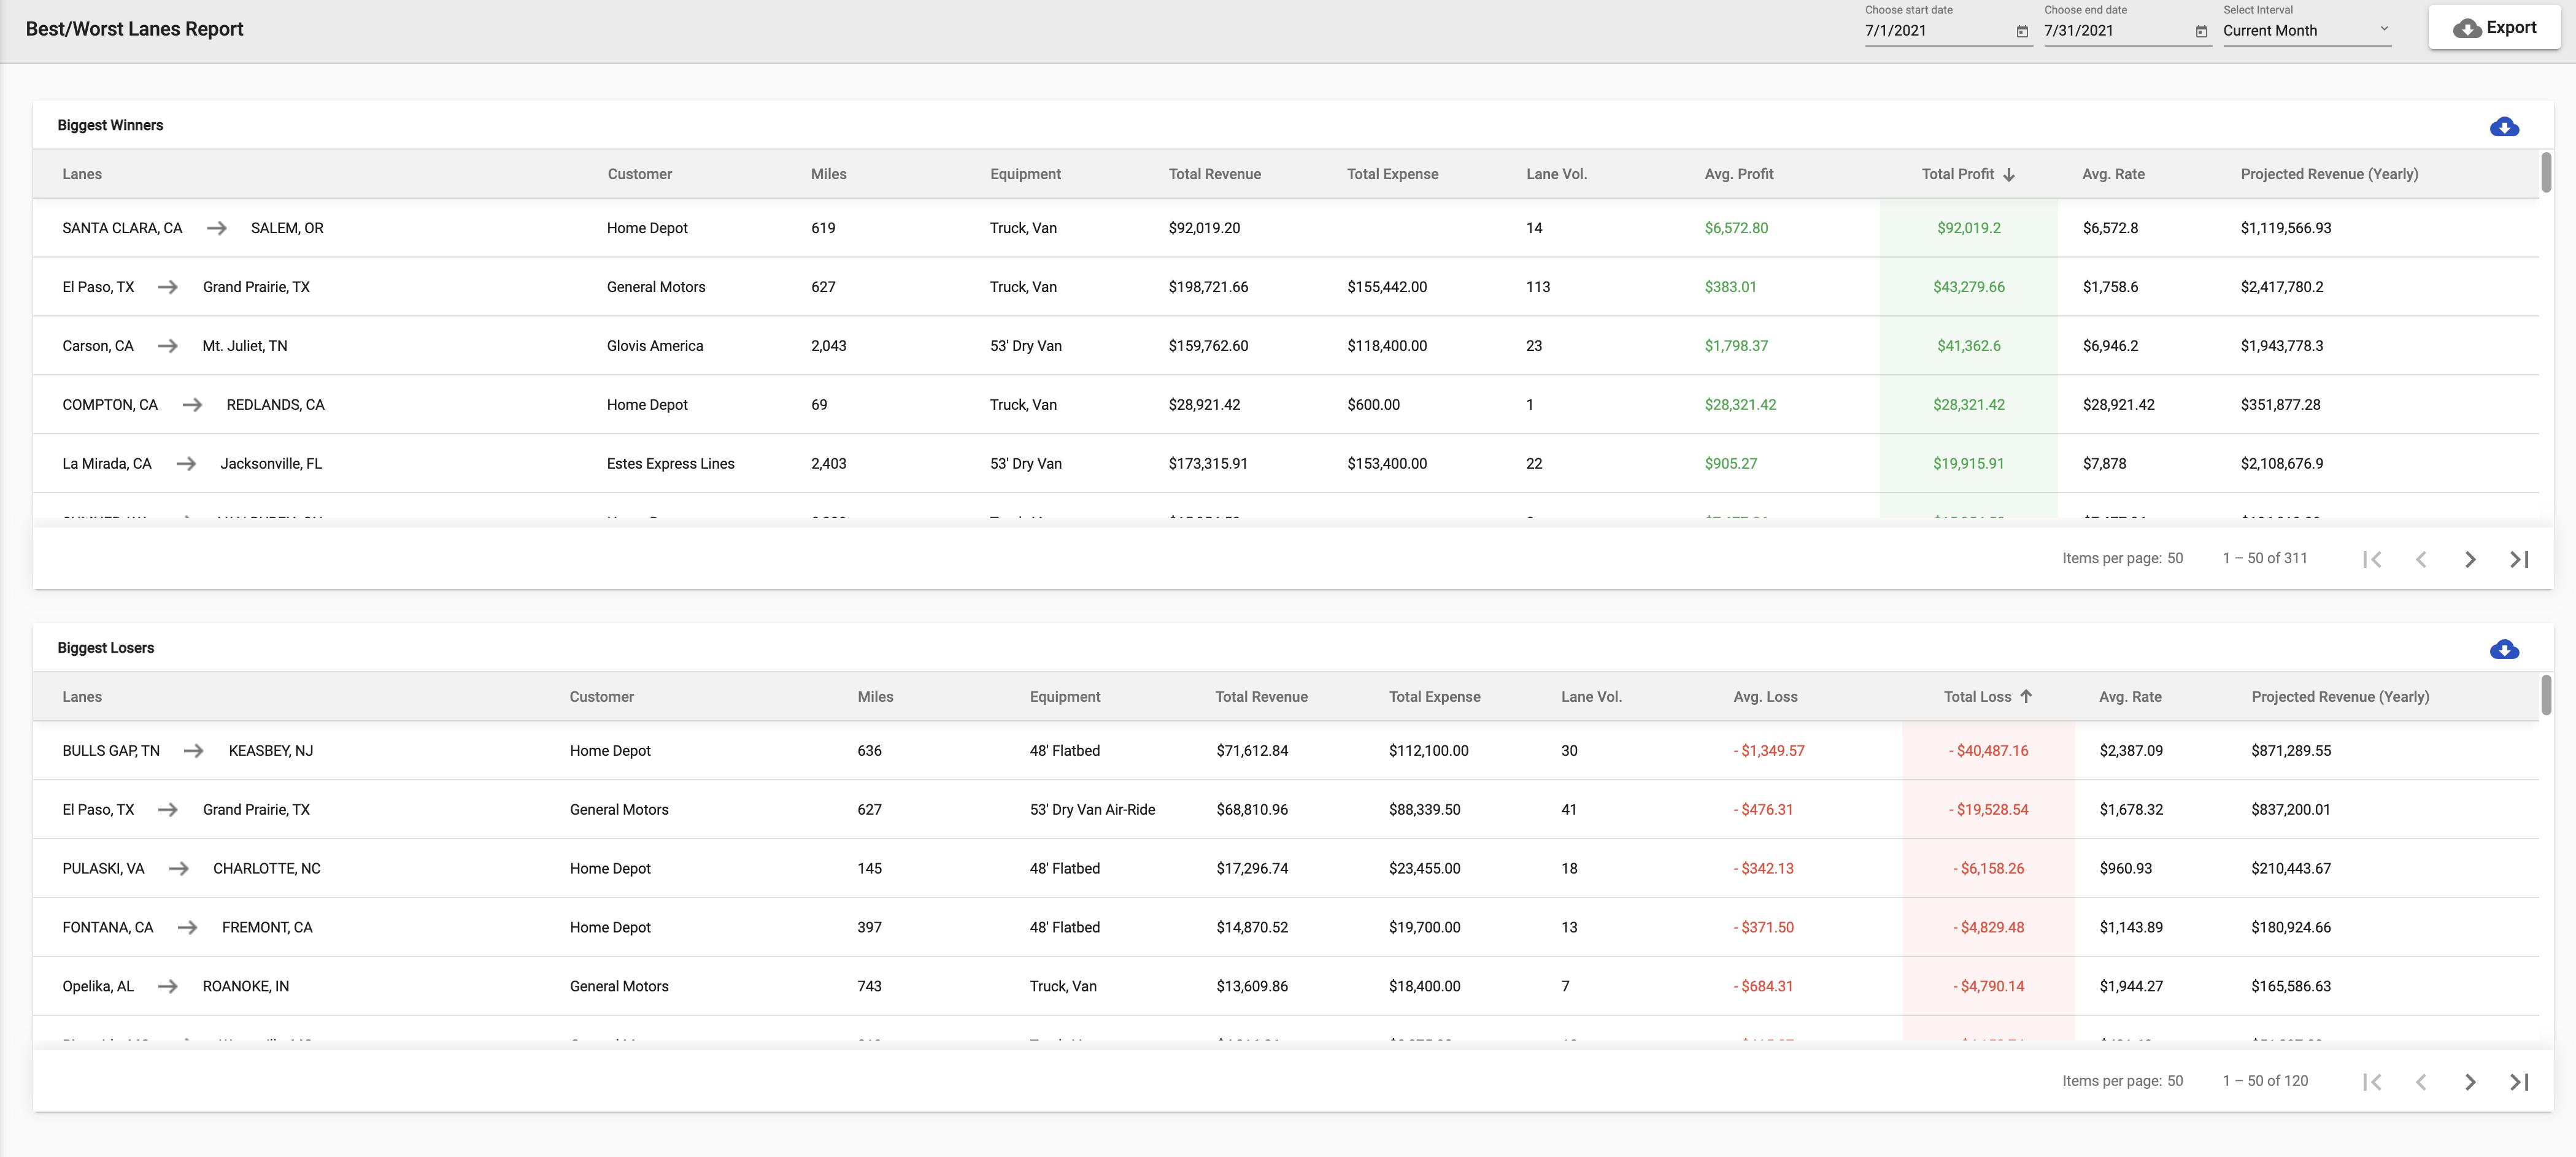
Except
The Lane History table is specific to only lanes for loads tendered to this carrier
There are some differences in the KPIs
Lane that the carrier has used is represented as a row on the data table
For each row, the data table has the following columns:
Lanes
Customer
Pickup Stops
Dropoff Stops
Miles
Equipment
Total Revenue = This is the sum of all money paid by the customer to the broker for all loads within this lane
Total Expense = This is the sum of money that was paid to the carrier for all loads within this lane
Average RPM = [Sum of the rate per mile for each load within this lane / Volume]
Volume = Sum of all loads within this lane
Avg Profit = [Total Profit / Volume]
Total Profit = [Total Revenue - Total Expense]
Projected Revenue (yearly) = Use logic from Lanes report
Link to Lanes Report Specs in Confluence
Data Table Rules
The data table columns should allow the user to sort
IF the results exceed the 25 line limit for that page, THEN sorting should apply to results from all pages, not only the current data table page
The data table should display a header and 5 rows
Pagination
The data table should load 25 results per page
The user can scroll down the data table to see up to 25 results
IF the results exceed the 25 line limit for that page, THEN the user can click on the next page to see more results
IF the user applies a filter, THEN filter should display results from all pages, not only the current data table page
The data table has a header with the title of the table
There is a button on the right that allows the user to export the data as a .CSV file.
Loads without Pickup and/or Dropoff Dates
IF the carrier has loads that do not have a pickup and/or dropoff date (for example, a service fail), these loads should still be included in the data table.
The date fields can have a “-” where the information is missing.